Launchd is Apple’s replacement in OS X for several Unix process management
utilities, most notably cron. I use it to run several scripts at
scheduled times or fixed intervals. Every day my computer is set to check my
library card for overdue books. Every morning my computer resets its volume to
medium. Every week it backs up the WordPress database of my “family pictures”
blog. It syncs my work files between my computer and the university file
server.
Almost anything you can do with cron you can do with launchd, but with more
power and flexibility. Unlike cron, launchd does not assume that your computer
is always running. So if your computer happens to be sleeping at the time a job
is scheduled, it will run the job when it wakes up. This is probably the best
feature of launchd, because it allows me to run scripts on my iMac while still
letting it sleep when I’m not using it.
I have pieced together what I know about using launchd to schedule jobs from
tutorials across the internet, trial and error, and the manuals. This is my
attempt to gather all my knowledge about this in one place. If there is
something you think I should add or fix, let me know.
(This article has been updated from the original version,
most notably with information about new software tools.)
The best way to get started is to buy LaunchControl.
LaunchControl doesn’t have to stay running in the background.
It just sets up the job and gets out of the way, letting OS X do the rest. And
since OS X already uses launchd to run just about everything, from Spotlight to
ssh-agent to the bezel notifications that appear when you change the volume,
scheduling jobs will not add any overhead.
Launchd basics
Each launchd agent is stored in an xml plist file. The file contains
information about what program to run, when to run it, which arguments to use,
and other options. Although technically you can make things work no matter
where the plist file is saved, it is best to put it in
~/Library/LaunchAgents, because plists in this folder are automatically
loaded into launchd when you log in.
Each agent has a label, which must be unique. Apple uses reverse domain syntax
com.apple.whatever, but it doesn’t matter. The plist filename can be
anything, but you would be crazy to use anything other than the label, e.g.
com.apple.whatever.plist. Sometimes agents are referred to by the file, and
sometimes by the label.
Warning: At some point you will use one of your plists as a template to
create another. You will of course give them different filenames, but you will
forget to change the label, which means only one of them will work. Hopefully
this warning will then enter your mind and you will solve the problem.
Apple uses the terms load and unload to mean that an agent is in the
system, ready to go, and start or stop to talk about running or killing the
actual process. So all agents in your LaunchAgents folder are loaded when the
computer starts up. Then it pays attention to when they are scheduled and
starts them at the appropriate time. If you create a new plist file you need to
load it manually. If you change a plist file, you need to unload it and load it
again.
Tools to manage your agents
Launchctl is Apple’s tool, which gives you most control at the expense of
complexity.
LaunchControl is a graphical interface for managing your agents. It gives you
you full control and does a good job of taming the complexity.
Lingon is another graphical interface for managing your agents.
Lunchy is like launchctl, but slightly more convenient.
Launchctl
Apple provides launchctl to manage your agents. The main commands
you need are
Notice that load and unload require the filename, while start and stop
require the label. The start command will manually run the job, even if it
isn’t the right time. This can be useful for testing. The stop command just
kills the process, but is convenient because you don’t need to know the pid.
The list command shows all loaded agents, with the pid if they are currently
running and the exit code returned the last time they ran.
LaunchControl
I mentioned LaunchControl earlier, and it is the tool I
recommend. It can create and edit your plist files, giving you
helpful information when you need it. It can start, stop, load, and unload your
agents and help you debug them when they fail.
(LaunchControl was released after the first version of this article, and it is good enough that it makes a lot of what is written here unnecessary.)
Lingon
Lingon is a simple tool for creating and managing launchd agents. It does not
give you as much control as LaunchControl, but it has been around longer. When
you use Lingon to edit an agent, pressing the Save button automatically loads
and unloads the job.
Lunchy
One other useful tool is Lunchy by Mike Perham. This is a ruby script
that speeds up the loading and unloading of agents by allowing you to refer to
a plist by any unique substring of the filename. My only issue is that it uses
terminology that conflicts with Apple’s. Lunchy uses start to mean load and
stop to mean unload. It mostly compensates by providing very useful
commands restart to unload and then load and edit to edit the file in your
default editor.
Install it using gem install lunchy and then edit the file using
lunchy edit archive-tweets
Now reload it using
lunchy restart archive-tweets
Format of the plist file
Here is a very basic plist file to run a script every 86,400 seconds.
 1
 2
 3
 4
 5
 6
 7
 8
 9
10
11
12
13
14
<?xml version="1.0" encoding="UTF-8"?><!DOCTYPE plist PUBLIC "-//Apple//DTD PLIST 1.0//EN" "http://www.apple.com/DTDs/PropertyList-1.0.dtd"><plistversion="1.0"><dict><key>Label</key><string>com.nathangrigg.check-library</string><key>ProgramArguments</key><array><string>/Users/grigg/bin/check-library</string></array><key>StartInterval</key><integer>86400</integer></dict></plist>
There are several other keys you can insert between lines 4 and 13 to activate
other options. If you want to see what is available, read the launchd.plist
manual.
Note that I have provided the full path to the script, since globs aren’t
expanded by default. If you want to expand globs, you can include an
EnableGlobbing key followed by <true/>.
If your script requires arguments, you would supply these in extra string
tags after line 9.
If you download a script from the internet or write one yourself, make sure it
is executable, or this might not work.
By default, anything written to standard out or standard error ends up in the
system log. If you would like it to be somewhere else, you can use the
StandardOutPath and StandardErrorPath keys.
The KeepAlive key allows a script to be run multiple times, depending on
certain conditions. If you set it to <true/>, then the script will be run
over and over again forever. The following snippet will rerun the script if it
returns a nonzero exit code. Read the xml as “Keep the process alive as long as
it doesn’t successfully exit”.
In most cases, the system will wait 10 seconds between runs of the script to
save system resources. You can adjust this with a ThrottleInterval key, which
takes an integer argument, and should be outside the KeepAlive dictionary.
You can also set the agent to stay alive depending on the (non)existence of an
internet connection using NetworkState or of a file using PathState.
In older versions of OS X, there was an OnDemand key which was required. It
is now obsolete and has been replaced by KeepAlive, which is optional. Many
of the other examples on the internet still have an OnDemand key, but you
don’t need it.
Permissions
For security reasons, launchd will not run LaunchAgents whose plist files have
the wrong permissions. For example, they must not be writable by anyone other
than the owner. Root LaunchAgents stored in /Library/LaunchAgents must be
owned by the root user.
Disabled agents
Both launchctl and lunchy allow you to disable an agent using the -w flag
with unload/stop. I do not recommend this. An agent that has been disabled
will not load when you log in and cannot be loaded using
load/start without using the -w flag again. You will probably just be
confused later about why an agent is not loading even though it is in the right
place. Information about which agents have been disabled in this manner is
stored in a separate file. In Lion, this is the file
where NNN is your user id number (find it using id -u).
Random thoughts
Your launchd agents are loaded when you log in, but not unloaded when you log
out. So the only time your agents aren’t loaded is during the time between a
restart and when you log in. If you have multiple users and need something to
run no matter who is logged in, you should put it in
/Library/LaunchAgentsor/Library/LaunchDaemons.
If your computer sleeps often, it will be asleep when jobs should run, which
means it will run them right when it wakes up, possibly before it connects to
the internet. I have experimented with KeepAlive and NetworkState to get a
job to repeat itself until there is a network connection. You could also use
SuccessfulExit and write the script so that it only returns a nonzero code to
mean “run again in 10 seconds.” Either method would have the script running
(and presumably failing) every 10 seconds when you have no internet connection.
A better idea would be to just sleep 5 seconds at the beginning of your script.
Or you could double the run frequency and hope for the best.
Here is a fun little experiment you can do while walking home today
that shows how much you depend on having two eyes.
Level 1
Pull your keys out of your purse or pocket. While walking at a normal pace, toss your keys up about a foot over your head. Tilt your head toward the place where the keys stop going up and start coming down. Keep walking, don’t move your head, leave your arm at waist level and catch the keys.
I’m not particularly coordinated, but when I did this I was surprised to see that I could catch my keys more than 9 times out of 10, even though I couldn’t see the keys for the last few hundredths of a second as they fell.
Level 2
Now try the same thing, but with one eye closed. Your results will vary, but my success rate fell to 1 in 5. Often I didn’t even manage to touch my keys on the way down.
Last week I was feeling tired of dealing with random AppleScript errors and bugs caused by my complete lack of understanding of the language. I ran across Apple’s AppleScript Language Guide (pdf), which gives a good overview of the language and explains why some things happen they way they do.
I am by no means an AppleScript expert, but here are a few useful things I learned from reading the guide. If you ever AppleScript, set aside an hour to read the guide.
POSIX file, file, and alias
There are three ways to specify a file in AppleScript
An alias can only refer to a file that already exists. Once an alias is defined during the run of a script, it will refer to the same file even if it is moved or renamed.
Both POSIX file and file refer to filesystem locations instead of files. If you want to refer to a file which does not yet exist, you must use one of these. The only difference between the two is that POSIX file requires paths in POSIX notation, and file requires paths in classic Mac notation.
If you need an alias but prefer to specify paths in POSIX form, you can use
POSIXfile"/Users/grigg/Desktop"asalias
If you have an alias or file and want the POSIX name, use POSIX path of the object.
Relative paths are not supported (except when run from a shell; see below) and tilde expansion is not supported.
Run AppleScripts as shell scripts
If you want to run an AppleScript from the command line, you can save the AppleScript as plain text with the interpreter listed in the first line:
#! /usr/bin/osascript
Then make it executable using chmod +x, and run it like you would any other shell script. Of course, your system will need to compile such scripts each time they are run, which in my quick experiment added only 10 to 30 milliseconds of overhead.
If you want to store your AppleScript as plain text but run a compiled version, you can use osacompile. If script.applescript is saved as plain text, then
osacompile -o script.scpt script.applescript
saves a compiled version as a binary file script.scpt. To run the compiled version, you will need to run osascript script.scpt.
AppleScripts run from the command line print their return value (or the result of the last expression, if there is no explicit return) to the output stream.
AppleScripts run from the command line can accept arguments (which are passed as a list to the run handler) and can use relative paths. The following script prints the full Mac-style path to the file listed as first argument.
AppleScript allows you to define variables using pipes as delimiters, for example |variable|, |my variable|, or |2^5|. Naming a variable |2^5| is probably not a good idea, but pipes can still be useful because of the way the AppleScript Editor treats them.
AppleScript reserves a lot of words for its own use. If you are sending commands to another application, this will also reserve a bunch of words. So if you need a variable name, there is a good chance you will accidentally use something you aren’t supposed to, which results in cryptic and annoying errors. Some people get around this by prefixing variables with my or the, as in theFile or myInteger. I have been known to use excessive underscores.
Another way around this issue is to use bars. The best thing is that AppleScript Editor removes them if they are not necessary. So you you write |variable| and nobody else is claiming this word, the editor will remove the bars when you compile or run, giving you confirmation that you are free to use this word.
Reference to a variable
AppleScript deals with variables pretty much the same as Python. Lists and records (dictionaries) are mutable and passed by reference. Strings and numbers are immutable and essentially passed by value.
For example,
setato{1,2}setbtoacopy3toendofa-- now a and b are both {1,2,3}
You can use copy a to b to create a deep copy or set b to items of a to create a shallow copy.
In AppleScript you can force pass by reference using the term a reference to.
onchange_to_5(b)setcontentsofbto5endchange_to_5setato0change_to_5(areference toa)-- Now a = 5
This can also be useful when dealing with long lists. According to the Language Guide, the most efficient way to append to a list is
copy5toendof(areference tolong_list)
I don’t understand why.
Extract elements of a given type from a list
I don’t know if I would ever actually use this, but I thought it was interesting. If you write
I have a love-hate relationship with AppleScript. The syntax is annoying, string manipulation is a pain, it is hard to debug, and scripts are stored in a binary format. But I would be incredibly sad if AppleScript went away. Interacting with other programs gives you a lot of power.
A recent example
Following the advice of Bram Moolenaar, I’ve been monitoring tasks that I repeat often which take longer than they could. I noticed that when writing Latex, I often need to change then name of an environment while editing. For example, I might have
Then I decide that I need to change it to an align* environment or just remove the star from the equation* environment, which means I have to edit both the begin tag and the end tag. Changing both at once will probably only save a few seconds, but those few seconds are saved over and over again, and typing becomes a little less repetitive and a little more productive.
Here is where AppleScript comes in. I need to get the location of the cursor, determine which environment contains it, prompt the user for a new name, make the change, and put the cursor back where it belongs.
The first two of these I could do with Python. BBEdit uses environment variables to pass information about the cursor to cursor position to shell scripts. Python would have no problem doing the searching. But prompting the user and making sure the cursor doesn’t jump due to a change in the length of the document require AppleScript.
The “Change environment” script is a new addition to my Latex BBEdit package, which incorporates lots of Latex related scripts and clippings I’ve made and collected. I’ll explain some of the useful details of the script in this post.
Get and set BBEdit’s cursor location
You can use AppleScript to get the number of characters between the beginning of the document and the current cursor location:
You can move the cursor around with the command select insertion point. In my case, if I replace equation* with align*, I would like to shift the cursor
left by 3, so that its relative position stays the same.
To figure out which environment contains the cursor, I search backwards from the cursor for a begin, then forward from that point for an end, and then I check to make sure that the cursor is between the two. If it is not, I repeat the process until it is. There is a little extra logic in there to deal with possible nested environments.
The result is an AppleScript “record” (dictionary) with keys found (was there a match?), found object, and found text. The found object has properties like characterOffset and length and startLine.
Notice the double escaped backslashes. AppleScript interprets each pair of backslashes as a single backslash, and BBEdit does the same. This sort of thing used to drive me nuts, but I’m better at it now.
Of course, things don’t really get exciting until you do a grep search. This one searches backwards from the cursor for any sort of begin and captures the name of the environment.
Calendaring is messy. You have one-time events, repeating events, all-day events, event locations, event attendees, time zones, alarms, and so on. To manage this complexity, you need an equally complex calendar application. For basic use, I get by (I actually use Apple’s iOS and OS X apps), but sometimes I need something more basic.
One situation in which almost every calendar application will make things difficult is making a calendar for a class I’m teaching. It would be difficult to create an event for each class meeting, with the topic we will discuss in the description of each event. It would be even harder when, five classes in, I decide we need to do something different one day and thus shift the topic of every remaining class back by one day.
Another situation is managing birthdays. I have a very large family (more than 70 if you count only siblings, in-laws, and their children) and would like to keep track of their birthdays (and ages if possible). At first this seems like a good use of a standard calendar app because you only have to enter something when someone new joins the family. Ages are harder, but you can just put the birth year in the event and do some subtraction. The problem is that I sometimes forget to add someone and it is impossible to notice until next year. Before I know it, I only have the birthdays of half of my nephews under 5, and I have no way of knowing (besides exhaustive search) which ones I am missing.
What I need is some kind of markdown for calendars. A plain text way to manage dates. Not for all my events, because my apps work well under most circumstances. I just need something for edge cases.
Of course, calendars can be exchanged via the iCalendar format, which is plain text (not related to Apple’s iCal Mac app). But this is a complicated format with the ability to do every crazy thing that I imagine CEOs make their secretaries do. It is not meant to be managed by hand.
When
Here is where a Perl script named when comes in. From the project website:
When is an extremely simple personal calendar program, aimed at the Unix geek who wants something minimalistic.
Count me in.
If you are using OS X and homebrew, you can install it with brew install when. It has no dependencies, so you could almost as easily install it yourself. (By install I mean “copy to your computer”, assuming you have Perl. Speaking of which, how is it possible that Windows doesn’t ship with Perl, Python, and Ruby? Man, I could never go back.)
When reads events stored in a plain text file. Each event is a single line, and repeating events are defined using either cron-like syntax (2012 * 01) or equations (y=2012 & d=1). It is efficient, Unix-y and beautiful. If you stick to the cron-like syntax, sorting the lines alphabetically sorts events chronologically, to the extent that repeating events can be sorted.
There is a special syntax for annual repeats that allows you to reference the year. So
1932* 06 10, Pierre Cartier (\a)
creates a repeating event, and the when utility calculates the age like this:
$ when
Thu 2012 Jun 7 6:31

Sun 2012 Jun 10 Pierre Cartier (80)
This is a perfect solution to my birthday problem. Family members can be sorted by age, which makes it easy to tell who needs added. It would be simple to convert the file to a basic iCalendar file which I could subscribe to in iCal or my parents could subscribe to in Google.
This would make a class calendar much easier also.
I recently learned about BBEdit’s menu scripts, which allow you to run an AppleScript before or after you do anything that uses one of BBEdit’s menus.
I write a lot of things in Latex using BBEdit, and many of these need to be printed. Since I am using BBEdit, my impulse is to print the document from the BBEdit menu (or by pressing Command+P while BBEdit is active). When I get around to collecting the pages from the printer, I find a beautiful color printout of the Latex source.
I have tried to retrain myself and failed, so it is time for an intervention.
BBEdit menu scripts
To make a menu script, create an AppleScript named after the menu item to which you want to attach it. In my case, I name it File•Print….scpt. Notice the use of the bullet (Option+8) to separate the menu from the menu item, and the ellipsis (Option+;) to match the menu name exactly. The script should live in the “Menu Items” folder in your BBEdit Application Support folder, which you may have to create.
The script should have a menuSelect handler. If the handler returns True, then the script replaces the menu item, that is, the menu item is not run. If the handler returns false, the the menu item is run after finishing the script.
My script checks if I am trying to print a Tex document, and if so, shows an “Are you sure” dialog. If I really do want to print, the script returns False, and the print process continues.
The script is not complicated. It checks to make sure the document is a Tex document, and if so, displays a dialog. It returns True or False based on the user’s input.
onmenuSelect()setskip_printtofalsetellapplication"BBEdit"togetsourcelanguageofdocument1ifresultis equalto"TeX"thentrydisplay dialog¬
"Are you sure you want to print the TeX source?"¬
withtitle"BBEdit Print"¬
buttons{"Don't Print","Print"}¬
defaultbutton2¬
cancelbutton1¬
withiconcautiongetbutton returnedofresultsetskip_printto(resultis not"Print")onerror--if they cancel the dialogsetskip_printtotrueendtryendifreturnskip_printendmenuSelect
You can use postmenuSelect to specify something to be run after BBEdit completes the menu item.
The moral of the story
For those of us who spend a lot of their computer time writing and manipulating text, having a good text editor and tweaking it to meet our needs can save a lot of time and frustration.
It is also very satisfying. I put in a little bit of time up front to save myself time repeatedly in the future. Then every time I use one of these little solutions, I imagine my past self saying to my current self, “Hey, let me do that for you.” This turns what would have been a tiny frustration into a tinysuccess.
I have been deep into Latex for the last little while, pounding out my thesis. It is a long process that involves a lot of editing, rearranging, and tweaking. Every time I revise another paragraph, I give thanks that I am using fast and powerful BBEdit, and not something slow and cumbersome like Word. But something has been missing.
A couple weeks ago, I read a post by Brandon Rhodes titled “One sentence per line”. He quotes the following advice from “UNIX for beginners” [PDF] by Brian Kernighan. Kerninghan is the K in AWK, so pay attention.
Start each sentence on a new line. Make lines short, and break lines at natural places, such as after commas and semicolons, rather than randomly. Since most people change documents by rewriting phrases and adding, deleting and rearranging sentences, these precautions simplify any editing you have to do later.
One common feature of Latex, HTML, Markdown, and many other markup languages is that they ignore single line feeds in the document source. Only my collaborators and I will be reading the source, so I can format it however I want. I might as well make life easy on myself.
Return policies
If line feeds do not affect the final document, when should I end a line?
On the one hand, I could press return only when necessary, for example, to end a paragraph. My document will contain long lines, but my text editor can wrap them for me. On the down side, the long lines could cause some trouble when I work from the command line, which generally won’t wrap lines intelligently. Also, programs which compare two versions of a file will usually be less helpful since they report differences on a line-by-line basis. (Using a word-by-word diff program will improve this, but the results are still inferior to a line-based diff of a file with short lines.)
On the other hand, I could wrap text using hard returns. Most editors will do this for me, so I’m not actually pressing return at the end of each line. This will result in shorter lines, which will make the text easier to read from the command line. In Latex I will get more precise error location, since Latex reports errors by the line on which they occur.
One disadvantage of hard wrapping is that it makes editing awkward. If I add one word to one line, I will end up pushing a single word down to the next line. Then my obsessiveness requires me to “reflow” the paragraph, removing line breaks and inserting new ones so that the lines are the same length. Even though most text editors automate the reflow process, making changes becomes quite tedious—edit, reflow, edit, reflow, edit, reflow, etc. Furthermore, each edit results in many lines changing, so comparing two documents is not much easier than when I soft wrap. Even worse, reflowing paragraphs often removes line breaks that I put in on purpose.
For example, if I make a change to the beginning of a paragraph that ends with the following text:
which can be found using the formula
\begin{equation} a^2 + b^2 = c^2 .
\end{equation}This is called the Pythagorean theorem.
Reflowing is often overagressive, resulting in
which can be found using the formula
\begin{equation}
    a^2 + b^2 = c^2 .
\end{equation}
This is called the Pythagorean theorem.
The reflowed text is still correct, and will produce the same output, but is much harder to read. This kind of thing is especially a problem in a Latex math document, where I am often switching back and forth between prose and structured mathematical formulas.
A better way
Kerninghan’s suggestion to end lines at natural breaks solves many of these issues. Documents will have short lines, which is helpful for when I need to work in a terminal or send parts of a document by email. Edits will generally change a small number of lines, which makes the diff tools work.
I get the added benefit of being able to rearrange sentences and phrases much more easily. For complicated technical statements, I can use newlines and even indentation to make the source easier to parse.
The disadvantage is that I now have to push the return key at the end of every line. For a simple document that won’t go through many revisions, this may not be worth it. But Kerninghan also points out that most documents require more revisions than we initially expect. For a dissertation, and probably any academic paper, it is worth the extra effort.
Old habits die hard
Even after a few days of ending my lines manually at natural breaks, I often find myself getting close to the “right margin”. Usually, there is a perfectly placed comma a few words back where I should have ended the line.
I made an AppleScript for BBEdit called “New line after punctuation”
that looks for the last punctuation mark on the line and inserts a hard return immediately after it. I have it assigned to the keyboard shortcut Control+Return.
Update: I have made some changes the the AppleScript, explained in this post. The new script is posted here.
I know I’m extremely late to the party, but I am finally using FastScripts.
Until now, most of the scripts I use are either shell scripts that I activate from inside Terminal, or scripts that I use inside an application that supports them, like BBEdit or BibDesk.
I had tried before to find a way to run scripts from arbitrary applications, but I was never happy with what I found.
Then I found FastScripts, which of course has been around forever. It does everything I want it to. My favorite part is the ability to create application specific scripts and keyboard shortcuts, which are only shown or run when a certain application is running. That way the menu (and more importantly, the keyboard shortcut space) isn’t cluttered with irrelevant scripts.
While I’m on the subject of clutter, I recommend removing system scripts from the FastScripts menu.
Here are some scripts I collected to get my FastScripts library started.
AppleScript is a great tool. It is awesome to be able to get the selected text from an application, grab the current URL from Safari, ask the user to choose a file, or show a dialog box requesting text. But writing AppleScript scripts is usually painful.
For anything mildly complicated, I would much rather write something in Python. So a lot of my AppleScripts look like this:
Get information from the user or currently open application
do shell script some_python_or_bash_script
Do something with the result
For yet another time, I recently found myself making an AppleScript where part 3 of the process involved composing an email to someone. It is difficult to take the result of the shell script (which is just a single, structureless string) and parse out multiple fields (body, subject, recipient) to pass to a complicated make new message command.
So instead, I made a Python wrapper around the make new message AppleScript command. Yes, that means I am using AppleScript to call a shell script which runs an AppleScript, but I’m okay with that. (Others have done the samething, but not with the full set of options that I wanted.)
Why use Mail.app?
There are already command line mail programs. Why not just use one of them? Two reasons.
First, getting mail to transfer properly is always a pain. Comcast won’t let you use their SMTP, and if they did, your message would probably be marked as spam. So you have to figure out how to hook authenticated SMTP up to Google, and then it breaks, and you just get sick of it. Currently, my best solution to this has been to pipe a message over SSH to my work computer, which has a fully functional transfer agent, just to send an email to myself!
Second, and more important, often you want to see the message and maybe edit it a little before you send it. This also minimizes the chance that a script will screw up and either not send the mail or send duplicates.
Create the AppleScript
AppleScript to create a mail message looks about like this:
tellapplication"Mail"makenewoutgoingmessagewithproperties{visible:true,¬
subject:"Happy Birthday!",content:"The big 60!"}tellresultmakenewtorecipientwithproperties{address:"[email protected]"}makenewattachmentwithproperties{file name:"cake.jpg"}endtellendtell
The first half of the Python script does nothing more than create an AppleScript and feed it to the osascript command.
#!/usr/bin/pythonimportsysimportargparseimportos.pathfromsubprocessimportPopen,PIPEdefescape(s):"""Escape backslashes and quotes to appease AppleScript"""s=s.replace("\\","\\\\")s=s.replace('"','\\"')returnsdefmake_message(content,subject=None,to_addr=None,from_addr=None,send=False,cc_addr=None,bcc_addr=None,attach=None):"""Use applescript to create a mail message"""ifsend:properties=["visible:false"]else:properties=["visible:true"]ifsubject:properties.append('subject:"%s"'%escape(args.s))iffrom_addr:properties.append('sender:"%s"'%escape(args.r))iflen(content)>0:properties.append('content:"%s"'%escape(content))properties_string=",".join(properties)template='make new %s with properties {%s:"%s"}'make_new=[]ifto_addr:make_new.extend([template%("to recipient","address",escape(addr))foraddrinto_addr])ifcc_addr:make_new.extend([template%("cc recipient","address",escape(addr))foraddrincc_addr])ifbcc_addr:make_new.extend([template%("bcc recipient","address",escape(addr))foraddrinbcc_addr])ifattach:make_new.extend([template%("attachment","file name",escape(os.path.abspath(f)))forfinattach])ifsend:make_new.append('send')iflen(make_new)>0:make_new_string="tell result\n"+"\n".join(make_new)+ \
"\nend tell\n"else:make_new_string=""script="""tell application "Mail"
make new outgoing message with properties {%s}
%s end tell
"""%(properties_string,make_new_string)# run applescriptp=Popen('/usr/bin/osascript',stdin=PIPE,stdout=PIPE)p.communicate(script)# send script to stdinreturnp.returncode
Dr. Drang recently complained about how inconvenient it is to send data to a subprocess in Python. I feel his pain, because I have spent plenty of time and trial and error to figure out how Popen and communicate work. The official documentation is no help, either.
In the end, though, there is nothing terribly ugly about the three lines that run the AppleScript. If you want to send anything to the subprocess’s stdin, you need the argument stdin=PIPE (or =subprocess.PIPE, depending on your import statement). Running communicate returns a tuple with the subprocess’s stdout and stderr, but only if you use the arguments stdout=PIPE and stderr=PIPE. So my script, communicate only returns the stdout (which I discard).
When you don’t specify stderr=PIPE, the error output is just passed along to the main process’s stderr (and so also with stdout). If you run my script from the command line, any errors from the osascript command will just be printed on your screen (unless, of course, you do something like 2>foo).
Use argparse
My newest rule to myself is “Never parse your own command line arguments.” Especially when I make something that I only ever plan to call from other scripts, and nobody but me is ever going to see, it is very tempting to do something stupid like require 8 positional arguments in a specific order.
Then you change some script somewhere and everything breaks. Or you want to use the script again and there is no --help. So you have to jump into source that you wrote a year ago just to figure out what to do. Not good.
The argparse library is new and replaces the short-lived and now depreciated optparse. But it has lots of useful bells and whistles. For example, with the type=argparse.FileType() option, you can add an argument that expects a filename and automatically opens the file for you. It also creates a --help option automatically.
Here is the second half of the script.
defparse_arguments():parser=argparse.ArgumentParser(description="Create a new mail message using Mail.app")parser.add_argument('recipient',metavar="to-addr",nargs="*",help="message recipient(s)")parser.add_argument('-s',metavar="subject",help="message subject")parser.add_argument('-c',metavar="addr",nargs="+",help="carbon copy recipient(s)")parser.add_argument('-b',metavar="addr",nargs="+",help="blind carbon copy recipient(s)")parser.add_argument('-r',metavar="addr",help="from address")parser.add_argument('-a',metavar="file",nargs="+",help="attachment(s)")parser.add_argument('--input',metavar="file",help="Input file",type=argparse.FileType('r'),default=sys.stdin)parser.add_argument('--send',action="store_true",help="Send the message")returnparser.parse_args()if__name__=="__main__":args=parse_arguments()content=args.input.read()code=make_message(content,subject=args.s,to_addr=args.recipient,from_addr=args.r,send=args.send,cc_addr=args.c,bcc_addr=args.b,attach=args.a)sys.exit(code)
When you run parse_args, it returns a special Namespace object, which has the parsed arguments as attributes. (Why didn’t they use a dictionary?) In my script, “recipient”, which is a positional argument because it lacks a leading hyphen, is stored in args.recipient. The subject is stored in args.s. If I wanted to, I could pass ["--subject","-s"] to add_argument, and then the subject would be stored in args.subject, but could be specified on the command line as either -s subject or --subject subject. With the action="store_true" argument, args.send will be true if the user gives the --send option, and false otherwise.
I have been using Jekyll to generate both this blog and my academic website for the past year, and I can confidently say that it has solved more problems for me than it has created. (This may sound like faint praise, but I assure you that it is not.)
Recently I have been annoyed at how long it takes to deploy updates to my website due to the way that Jekyll mangles timestamps, which rsync depends heavily on. I finally broke down and spent some time improving the process by tweaking rsync to work better with my Jekyll setup.
The Jekyll timestamp problem
It has always bothered me that Jekyll mangles timestamps. When you run jekyll to regenerate your site, all timestamps are updated to the current time. (This is because all pages are regenerated—a separate and also annoying issue.) So to anything that uses timestamps to determine when a page has changed, it appears that every page changes whenever a single page changes.
There is no solution to this problem within the Jekyll framework. Each output file is created from several input files, so you could imagine setting the timestamp of each output file to be the maximum timestamp from all of the input files. But the input files often live on several computers and/or in a git repository, which makes the timestamp of the input files both ambiguous and worthless. In these circumstances, the timestamp of a file is not the same as the last modified time of the actual data. The only way to preserve the latter is through some external database, the avoidance of which is essentially Jekyll’s raison d’être.
Rsync complications
I can overlook the fact that the file metadata on my web server is meaningless, but I have a harder time ignoring the slow deployment this causes. My academic website currently has 43 megabytes in 434 files, all but 400 kilobytes is archival stuff that never changes, and usually I am only changing a few files at a time. Nevertheless, rsync usually takes 15 seconds, even if I am transferring within the campus network.
I have two sets of files. I want to take all the differences from my local set and send them to the server set. For each pair of files, rsync checks that the sizes and modification times match, and if not, it copies the local file to the server. It has an efficient copy mechanism, so if the files are identical despite having different modification times, very little data is sent. If a large file has only changed in a few places, only the changed chunks are sent.
If you use Jekyll, the modification times never match, so all files are always copied, albeit in an efficient manner. Despite the efficient transfer mechanism, this is slow.
The correct way to use rsync with Jekyll
What you want is for rsync to compute and compare checksums for each pair of files, and only transfer files which have different checksums. You can do this by using the --checksum (or -c) option. Despite a warning from the rsync manual that “this option can be quite slow”, it reduced my transfer time from 15 seconds to 2 seconds.
Here is the command I recommend to deploy a Jekyll site:
A side benefit of this tweak is that server timestamps have meaning again. If the local and server files have the same checksum, nothing is copied. The timestamp of the file on the server is now the time the file was last copied to the server.
If you use the --times (or -t) option, the server timestamps are manipulated to match the (meaningless) local file timestamps. This is not what you want.
If you use the --archive (or -a) option, which is recommended by almost every rsync tutorial out there, you are implicitly using the --times option, as -a is equivalent to -rlptgoD. This is also not what you want. For a Jekyll site, the only part of -a that you care about is the -r. So don’t use -a.
Miscellaneous notes on rsync options
The --itemize-changes (-i) option is a useful way of seeing what is transferred.
The --ignore-times (-I) option ignores timestamps, but not in the way you want. It simply copies all files no matter what (but still using the efficient transfer mechanism).
If you leave off the --times option and don’t use --checksum, then all files which have matching timestamps are skipped, and all other files are transferred, which changes their timestamp on the server to the current time. If you continue this over time, more and more files have different timestamps even though they are the same, which means they are copied every time.
There is a --size-only option which skips files if they have the same size on the local computer and the server, even if they have different modification times. You are tempting fate if you use this option.
[Note: Due to changes to Heroku’s offerings, the online version of this has
been shut down.]
I am teaching a differential equations course this quarter. Most of my students
find slope fields very useful to visualize the set of solutions to a first order differential equation. Here is an example:
Since I know y’ as a function of y and t, I draw a short line at each point (t,y) with slope y’. Then every solution to the differential equation must run tangent to all of these little lines. If you think of the lines as the flow direction of a river, the solutions are the lines traced out by dropping a stick in the river and watching it flow.
Slope fields are incredibly easy to draw, you just have to plug in 900 or so combinations of t and y. But it isn’t something you want to do by hand.
There are quite a few slope field generators out on the internet. Most of them are written as Java applets, like this one that I have pointed my students to in the past. Java applets are always painful to use and don’t work at all on the iPad, so I put together a Python script to draw the slope field.
Here are some of the different technologies that go into making this work. There is something for everyone.
Scalable Vector Graphics (SVG)
Until now, my only real experience the SVG format is the SVG gnuplot terminal, which I use to monitor the weather near my house. It is a vector format, which makes it great for line-based drawings. It is based on XML, which makes it easy to manipulate. Even better, it is human-readable. Here is the code for one tick mark:
<linex1 ="47.2"y1 ="121.5"x2 ="54.3"y2 ="127.1"/>
You can imagine how easy this makes it to generate the graph using Python.
In HTML5, you can use the svg tag to embed the SVG code directly into the html file, and all current versions of major browsers support this. So if you want to see what the code looks like for the slope field above, just view this page’s source.
Python generator functions
Most of the time, I’m writing scripts to do stuff on my personal computer. I make excessive use of long lists and giant strings, never worrying about memory. This is analogous to using UNIX commands one at a time, writing the output to a temporary file each time.
Generator functions can be used to implement a pipeline structure, like when you chain UNIX commands. You can link several generator functions so that each one uses the output of another. Similar to a UNIX pipeline, the functions run in parallel, and there is no need to temporarily store the output.
Here is an example, a modified version of what I used to make the slopefield.
 1
 2
 3
 4
 5
 6
 7
 8
 9
10
11
12
13
14
defslopefield(fn,tmin,tmax,dt,ymin,ymax,dy):"""Generator for the slopefield ticks"""t=tmin+0.5*dtwhilet<tmax:y=ymin+0.5*dywhiley<ymax:# tick calculates the endpoints of the tickyieldtick(t,y,fn)y+=dyt+=dtfortickinslopefield(fn,tmin,tmax,dt,ymin,ymax,dy):# svg generates one line of svg codeprintsvg(tick)
The yield statement makes slopefield a generator function.
You could actually do this whole thing without a generator by replacing yield tick(t,y,f) with print svg(tick(t,y,f)). But when I was testing my code, I found it very useful to be able to access the intermediate data, e.g.
The great thing is that slopefield only generates its output as needed. There is no need to store it in memory somewhere.
You can only use a generator one time through.
Input Sanitization
Originally, I thought that I would parse the equations by myself, because the eval command can be used to execute arbitrary code, and that sounds pretty scary. I thought about using pyparser, but decided I was being ridiculous.
I convinced myself that it would be safe to use eval with the following sanitization, which checks every word of the string against a whitelist.
defsanitize(fn_str):"""Sanitizes fn_str, evaluates, and returns a function"""VALID_WORDS=['','sin','cos','tan','t','y','abs','sqrt','e','pi','log','ln','acos','asin','atan','cosh','sinh','tanh']# separate into words on number and operator boundarieswords=re.split(r'[0-9.+\-*/^ ()]+',fn_str)forwordinwords:ifwordnotinVALID_WORDS:error('Unrecognized expression in function: %s'%word)s=fn_str.replace('^','**')# replace 1.232 with float(1.234)s=re.sub(r'[0-9.]+',r'float(\g<0>)',s)returneval("lambda t,y: "+s)
I wrap the numbers in a float command because Python does arbitrary-precision integer arithmetic, and I don’t want people to be able to type stuff like 9^9^9^9^9^9^9^9 and set the processor going crazy. That, and we avoid any integer division issues.
As noted above, I had to shut down the sample version of this due to Heroku changes, but the code is on GitHub.
Publishing a mathematics research paper is a complex and entangled process.
If a math professor wants to get tenure, they need to publish their research in prestigious journals, so they submit papers to these journals. The journals, whose editors are other mathematicians, send the papers off the be peer reviewed. Neither the editors nor the reviewers are paid by the journal. The journal doesn’t even have to typeset the paper, since almost all math papers are written in Latex (99 percent, according to the sample I took of papers posted to the math section of arXiv.org). The paper is eventually published, and the journal charges a pretty high price for printed or electronic versions of the paper (sometimes over a dollar per page, which is paid primarily by university libraries). The main thing that the journal provides is its reputation, which serves as a very useful signal about the quality of the papers it contains.
There has been some talk in the past several years about open access in academia. The reasoning is that if taxpayer money is funding basic research, the results should be available to everyone at little or no cost.
The math community has open access almost completely figured out, thanks to the arXiv.org repository (which we usually refer to as “The arXiv”, which is pronounced “The Archive”, because the X stands for the greek letter chi). Although you transfer copyright to the journal when they publish your paper, what you do beforehand is generally your business. So before you submit your paper to a journal, you submit it to arXiv.org, which will post it online forever. Although I don’t know statistics, the vast majority of papers published today are listed on arXiv.org.
Journals are still necessary because of the peer review process and the prestige factor. In addition, not all authors incorporate corrections and changes that they make to their paper during the peer review process into the arXiv.org version. Actually, some journals prohibit you from doing this, although in practice, the word is if they ever tried to crack down on this there would be mass revolt.
That doesn’t mean the community is happy with journals. It would be nice if they allowed more open access, or charged less, etc. To this end, some are participating in a boycott of one company that is seen as a “worst offender”. They have comparatively high prices, they try to stop you from publishing changes to arXiv, and they lobby in favor of legislation against open access. (You probably aren’t surprised to hear they also were in favor of SOPA.)
Organizing arXiv.org papers
The reason I’ve been thinking about this is that a lot of the papers I read come from arXiv.org, and I’ve been trying to improve the way I keep track of the papers I read.
My workflow for managing papers I read goes something like this:
Find a paper I want to read, usually from a citation or the arXiv.org RSS feed.
Download a PDF to my iPad or Dropbox folder. Usually it has a stupid file name, but I don’t worry yet.
(time passes)
Import the citation into BibDesk. BibDesk automatically renames the file using the author and title and moves it to my folder on my Dropbox.
The difficult part is step 3. It is very useful to use BibDesk to organize the metadata for the papers I read, but it can be unnecessarily time consuming. BibDesk can import from many different websites, this usually requires you to do search using BibDesk’s built in browser for a paper that you already found once before.
This week I wrote a Python script to download arXiv.org references. It takes one or more arXiv identifiers and returns a citation for the corresponding paper in BibTeX format. Using the script I wrote, together with BibDesk’s great AppleScript integration, I can simply enter the arXiv id (which is watermarked onto the article) and everything else happens automatically.
I’m feeling a little pressure after Dr. Drang, whose blog I read regularly and benefit from often, linked to my blog. I’ve always written this blog with an eye toward future searchers of the internet, seeking to return the favor for all the unassuming blogs that have helped me stumble to a solution to my technical problems. So the fact that this blog had an average readership of 2.5 (my wife Amy being one of those) has never bothered me. And while I don’t expect a recommendation from Dr. Drang to change things too much (although I would listen to him), I feel special having suddenly gone from anonymity to having a “Gruber number” of 2 (because I was linked to by a blog that has been linked to on Daring Fireball).
From the early days, Google implemented a plus operator in its searches.
When you use Google to search, they make pretty liberal use of synonyms. So if you search for “pouring”, Google also returns results for “pour” and “pours” and “poured”. If you search for “tech”, Google will also return results for “technology”. “Russian astronaut” includes pages that mention “cosmonaut”. It use to be that if you wanted to disable this behavior for a specific word, you could put a plus sign in front of it. Now that the plus sign has special (and much less useful) meaning on Google, you can get the same functionality by enclosing a single word in quotes.
But quotes are much harder than a plus sign, because they come in pairs.
My most common use scenario is this: I’m searching for something kind of obscure, and nothing useful shows up in the first page of results. Instead of clicking to the next page, I refine my search. (Honestly, if it isn’t on the first page, why would it be on the second? Or do you plan to do an exhaustive search of the index?) By looking at which words Google shows in bold, you can often tell that the synonym feature is messing with your results, and turning it off will get you what you want.
In the old days, this meant one click, one plus sign, and one press of the return key. Now, it is click, type, back to the mouse for another click, another key press, and finally return. And if I’m using my iPod or iPad? You can guarantee that at least one of those taps will require the use of the magnifying glass.
And just to prove that this is not just academic grumbling, here is one of the several times that I used this today. I used homebrew to install an updated version of imagemagick because the stock version was being dumb. While it was doing its thing, homebrew said something about “pouring” imagemagick. I headed to Google to investigate. You can imagine what results you get if you search for homebrew pouring, but even if you throw mac on to keep things relevant, you get install guides instructing you to “pour yourself a cup of coffee while you wait.” In fact, the if you narrow down your search further with a term like imagemagick, Google, which is still substituting “pour” for “pouring”, just heads to the French corner of the web, where the word “pour” is found in abundance. Some well placed quotes and a shake of my first at Google Plus for stealing my efficiency, and I’m in a much better place.
It turns out that homebrew was downloading a precompiled binary.
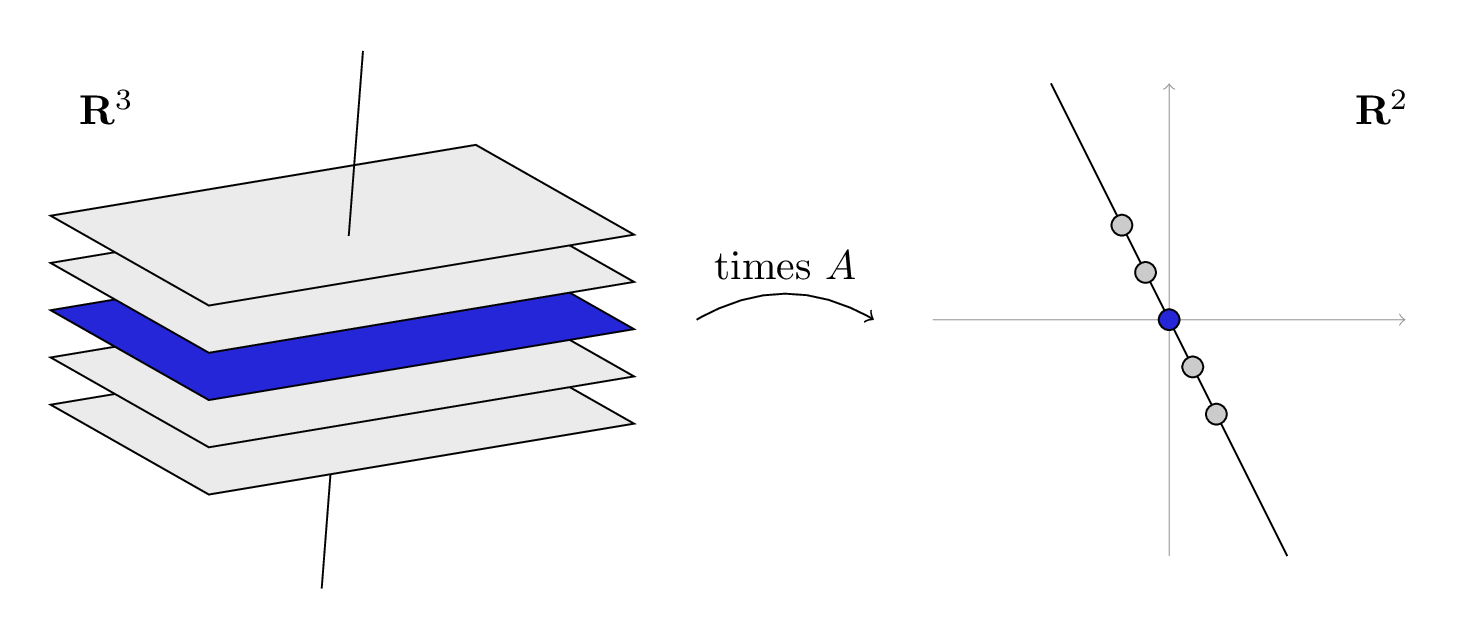
TikZ is a Latex package that lets you make graphics and diagrams.
I have been meaning to check it out for a while now, but this week I finally had a need. Two days of class were cancelled last month due to snow, and the class I’m teaching to needs speed through some topics. So I made some notes for my students, and I drew this depiction of a linear transformation:
The advantage of TikZ over another drawing program is that it is easy to integrate it into a Latex document, matching fonts and font sizes. It is also very easy to include mathematical formulas in your drawings. And the input files are text files, which makes it easy to keep track of or share your drawings.
The advantage of TikZ over pstricks, which is another popular Latex drawing package, is that you can compile it straight to pdf, instead of generating postscript and distilling.
The code that you use to make a picture is very mathematical. This makes it a little difficult if you want to, say, make a new logo for your business, but for simple mathematical objects, it actually makes things easy. Here is an example of the code to draw one of the planes (which are, of course, actually parallelograms).
\begin{tikzpicture}\draw[fill=blue] (-2, 0.6, 1.4) % starting point
-- ++(3.6, 0.6, 0) % move along this vector
-- ++(0.3, -1.8, -2.7) % then along this vector
-- ++(-3.6, -0.6, 0) % then back along that vector
-- cycle; % and back to where you started
\end{tikzpicture}
The minus signs tell it to make a path, and the plus signs indicate relative movement. The code for the entire picture is here.
TikZ also works great for diagrams. Having tried my hand at xypic and diagrams and amscd and probably others, I don’t think I’ll ever use anything else. If you want to see how to use TikZ for diagrams, check out this article by Felix Lenders.
This package makes it easier to use BBEdit to write Latex.
What it can do
Typeset your document and locate any errors
View the pdf output, with SyncTeX support if you use Skim
View warnings and errors from the log file
Close environments, change environments, and add or remove a star from an environment.
Look up documentation using texdoc
Check your semantics using chktex
There are also a number of BBEdit clippings to insert often-used Latex commands. BBEdit makes it easy to assign keyboard shortcuts to the clippings you use most.