If you want to feel emotions and human connection, take your kid to the DMV drive test and chill with the family members of the other testers while your loved ones are out on their drives.
In yesterday’s post about sunrises, I made a snarky offhand comment about
certain places being in the wrong time zone.
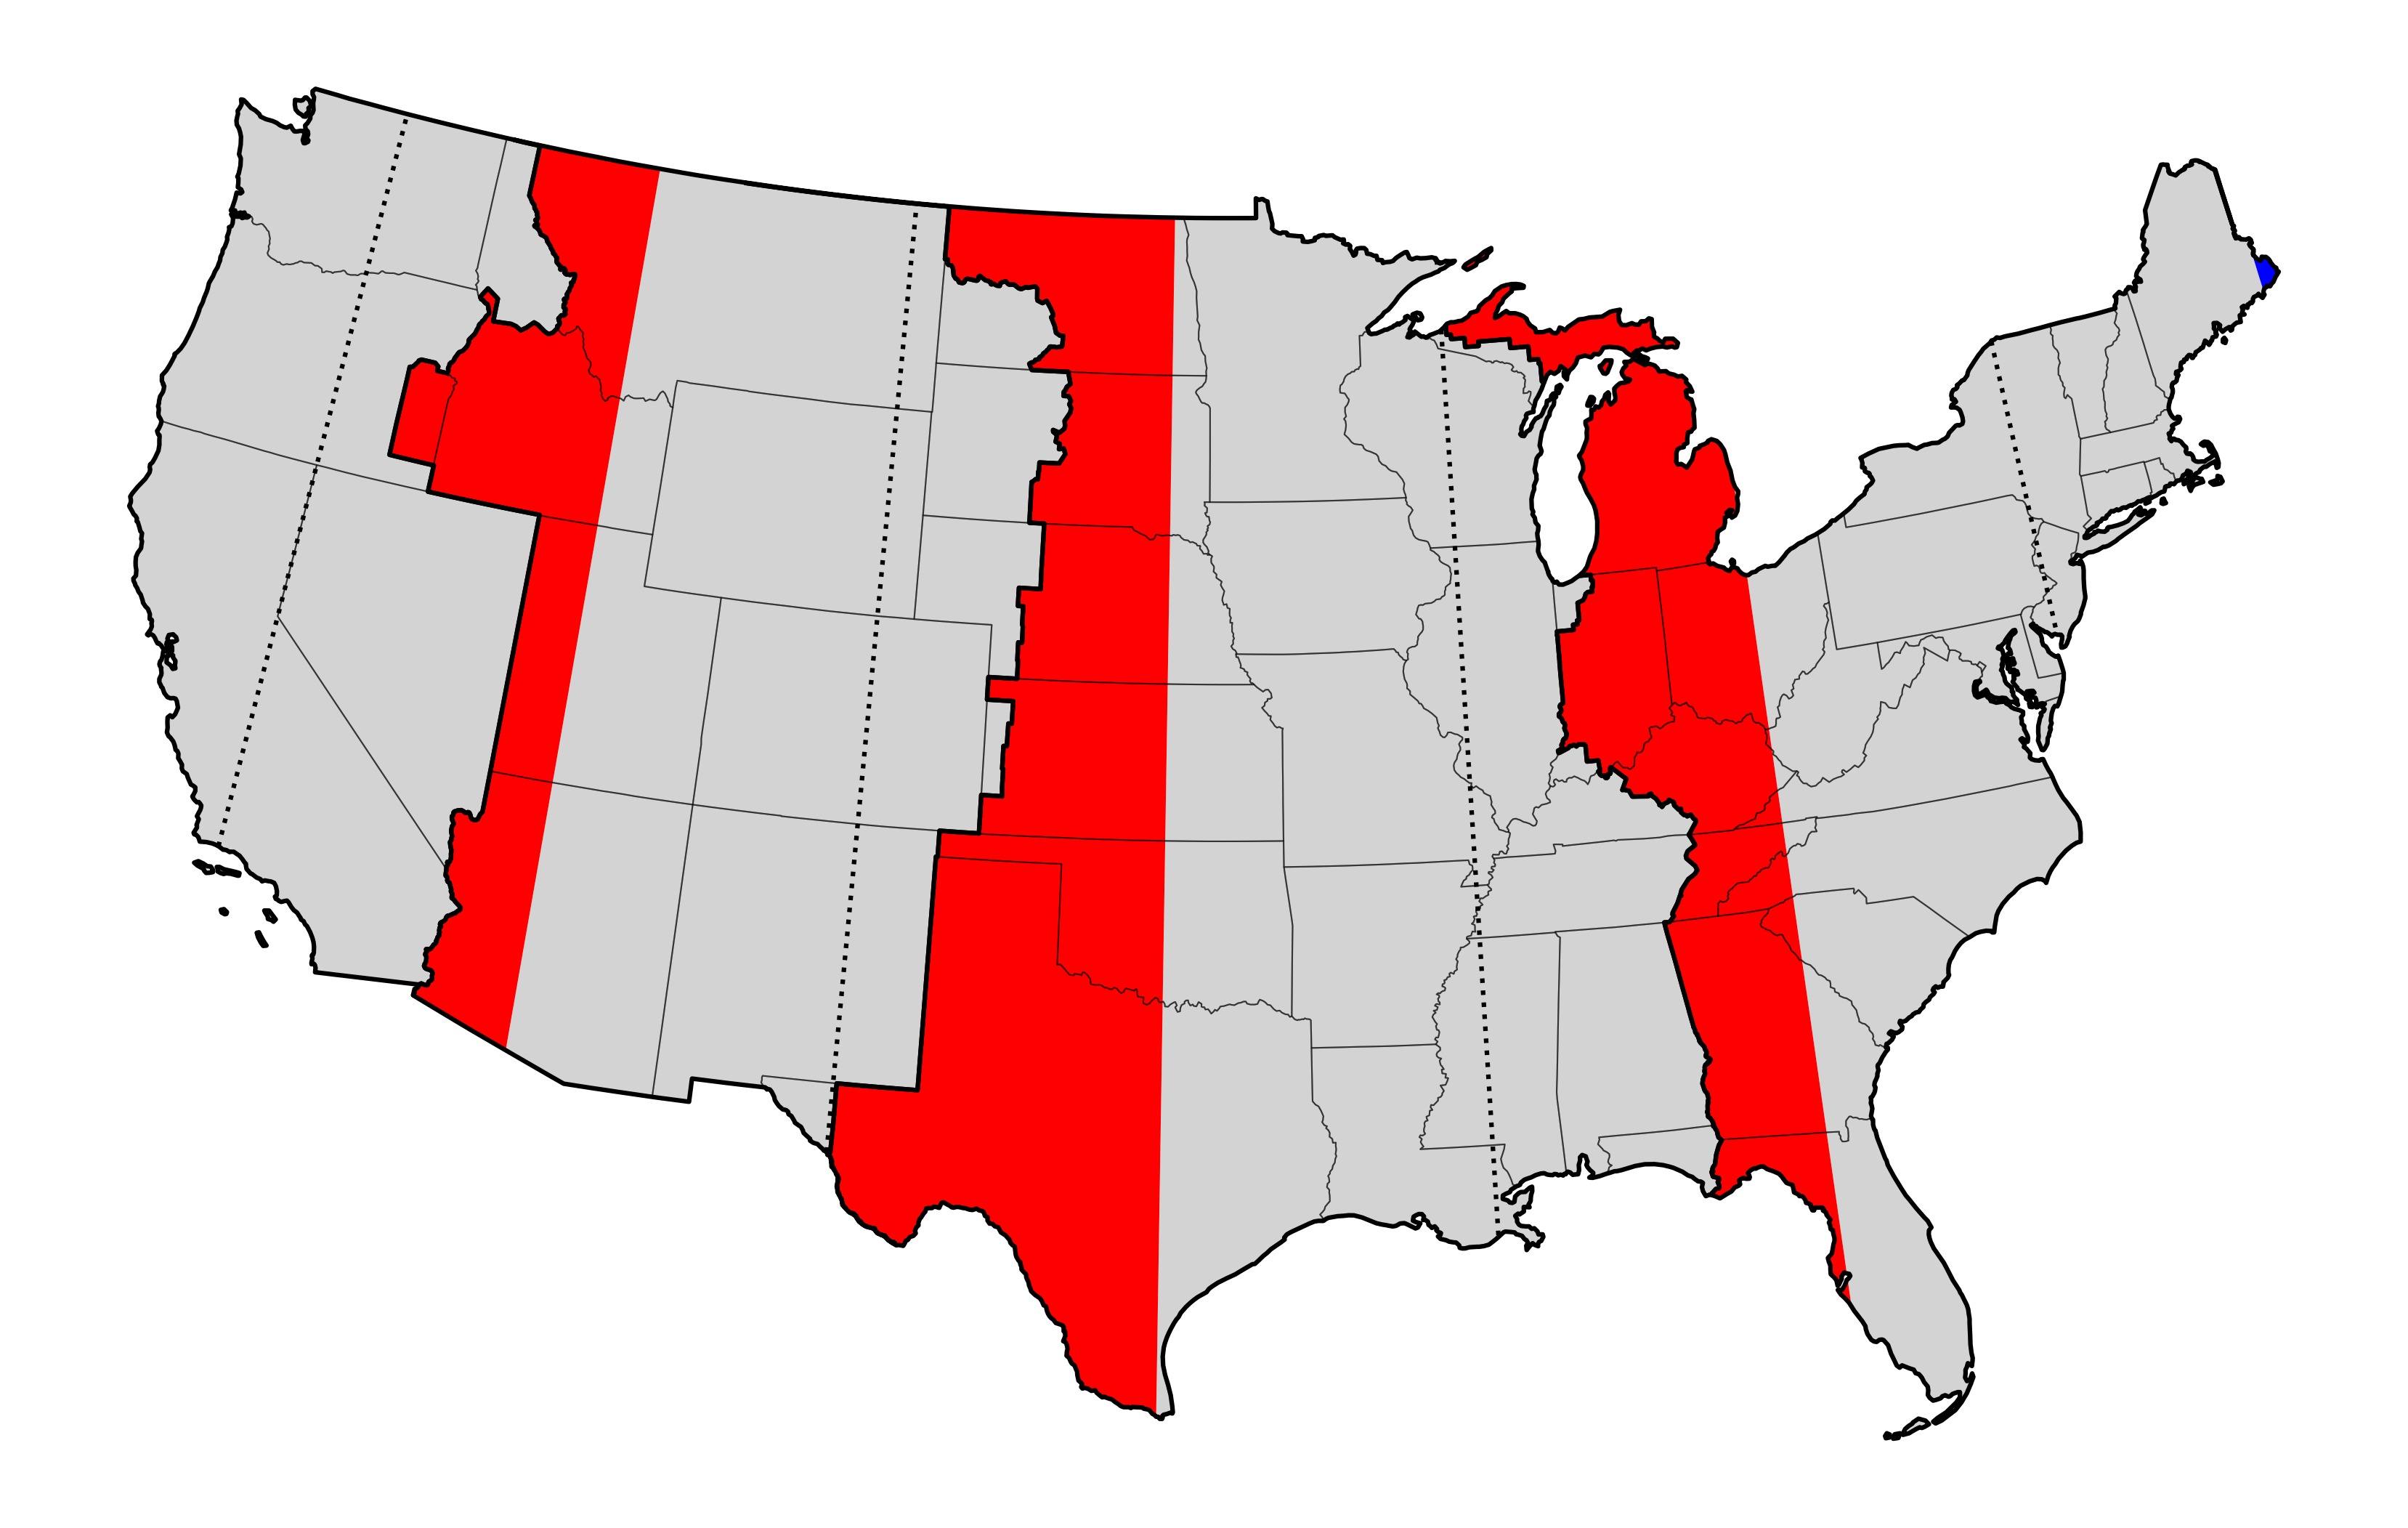
Today I drew a map that highlights the locations that are more than 7.5 degrees
from the central longitude of their time zone. (US time zones are spaced every
hour, which corresponds to 15 degrees of longitude.)
If you are in the correct time zone, then your average solar noon is between
11:30 a.m. (if you live on the far eastern edge) and 12:30 p.m. (on the far
western edge) Standard Time.
A few states and parts of several others are clinging to the Eastern Time
Zone when they should join Central. The Great Plains states and Western Texas
should really join Mountain Time. My birth state of Idaho should observe
Pacific Time.
Instead, these locations are all running 30-60 minutes later than they should
be. And of course, if we do end up switching to full-time Daylight Saving Time,
that will become 90-120 minutes, which seems pretty ridiculous to me.
Then again, they already spend two-thirds of the year in that condition, so
this misalignment isn’t exactly new.
(You may notice that a tiny sliver of Maine is actually too far east for the
Eastern Time Zone, but that one seems like not a big deal.)
Inspired by Dr. Drang’s plots illustrating the potential effects in
Chicago of a move to permanent Daylight Saving Time in the US, I wanted to
investigate which places would have the hardest time in the dead of winter.
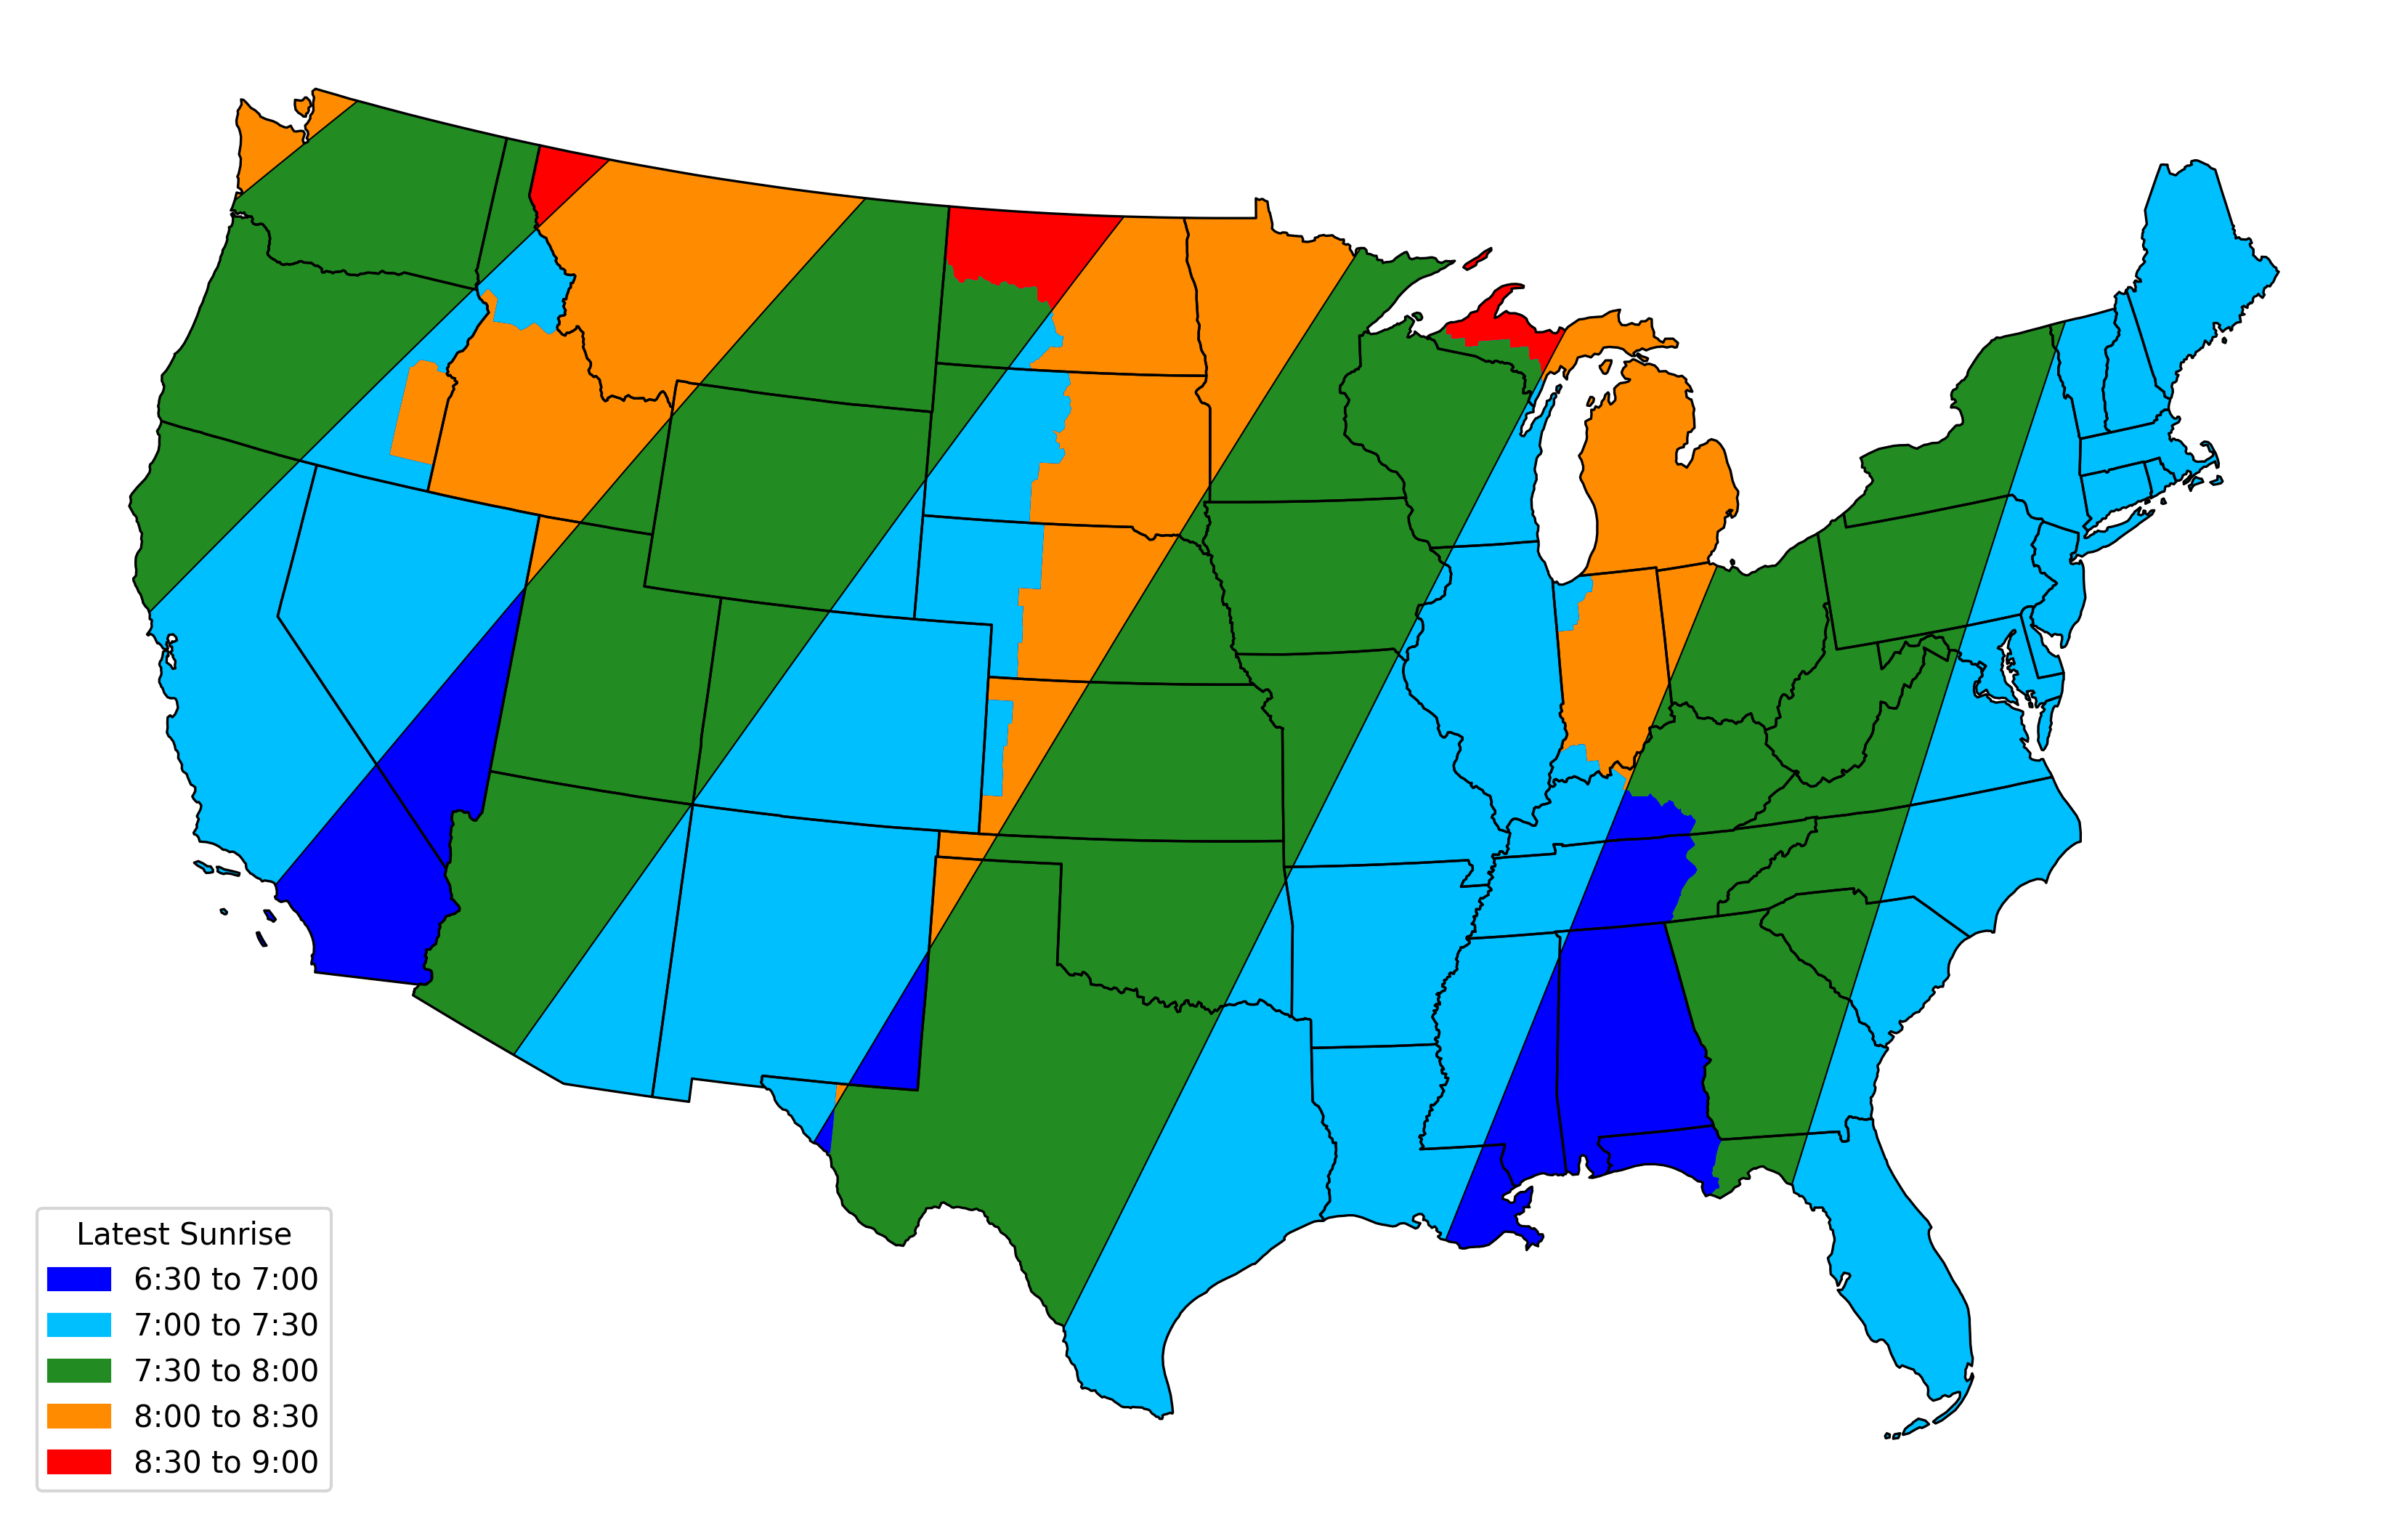
I ended up with this map of the USA Lower 48, with regions shaded by the
latest sunrise time that occurred between January 1 and January 15,
2026.
If any location were to switch to permanent DST, their latest sunrise would be
an hour later than shown in this map.
I have very little sympathy for the orange and red zones, which currently see
their latest sunrise after 8:00 and would move to a post-9:00 sunrise. Parts of Washington,
Montana, and Michigan are very far north and there is only so much we can do to help.
In all other cases, you are in the wrong time zone anyway; this one is on you.
I do feel for the green areas, which are properly situated but would have to suffer
through at least a few sunrises between 8:30 and 9:00.
Of course, I think it is silly to use permanent DST rather than permanent
Standard Time. Sure, a lot of our habits have been built up around astronomical
noon being closer to 1 p.m. for most of the year, but I’m sure we would figure
it out quickly enough.
I’ll be fine either way, since I’m right on the boundary between dark and light
blue. I would survive shifting our worst-case winter 7:00 sunrise to 8:00.
Note that, ignoring DST, the latest sunrise is typically in January rather
than at the winter solstice. But also in some southern areas (including where I
live), the seasonal variation in sunrises is small enough that the latest
sunrise time is actually in March or November, right after the shift to DST or
before the shift back to Standard Time.
I’m not going to post the Python code I used for this because it was
AI-assisted and sloppily thrown together. I used
geopandas to read Natural
Earth time zone data (both
AI choices), and skyfield based on
my previous experience with astronomical calculations. I used
scipy to solve for the boundary points
and then shaded the regions using matplotlib.
Earlier this week, I put together a quick Jupyter notebook to figure out who
plays which third-place team in the Round of 32.
I parsed the Wikipedia table into a Pandas DataFrame with 20 columns:
Twelve columns named 'A' through 'L' with values True or False,
indicating that the third-place team from that group qualified for the Round
of 32.
Eight columns named 'vA', 'vB', etc., for the eight first place teams
that are slated to play a third-place finisher. The value of these columns is
3A, 3B, etc., for the matchup that will result for the set of third place
finishers determined by the values of the first eight columns.
For example, this is the row of the table assuming that the third place
finishers from groups A, C, H, and K fail to advance (with True/False shortened
to T/F for brevity):
A
B
C
D
E
F
G
H
I
J
K
L
vA
vB
vD
vE
vG
vI
vK
vL
F
T
F
T
T
T
T
F
T
T
F
T
3E
3G
3B
3D
3J
3F
3L
3I
Now I have been whittling down the options with the following Python code,
where df is the name of the DataFrame.
The ix variable is a Pandas index selector. For each character of IN, the
corresponding column must be True. For each character of OUT, the
corresponding column must be False. And finally, for each of the undetermined
teams in ORDER, which are sorted by their current ranking, it cannot be that the
lower-ranked team gets in while the higher ranked team does not. In Boolean logic
terms, this is “x implies y”, which is the same as “(not x) or y.”
Then sum(ix) will get you the number of selected columns. Finally, I arranged
everything into a new table that has as its rows the vX labels, as its
columns, the 3X labels, and as its values, the number of scenarios left
for which that matchup is possible:
Options remaining: 8

   3E 3C 3J 3G 3B 3D 3I 3A 3F 3L 3K
vA  7  1
vB        1  7
vD              8
vE                 8
vG        2           2  4
vI                          8
vK  1                 3        4
vL        1           3           4
You can see from this that one of the most disruptive scenarios left would be
for 3C to play against 1A, but there is only one scenario left in which
Scotland makes it through at all, which is that every single match today goes
their way. That would mean Croatia losing by 3 or more, Congo failing to win,
and some kind of lopsided win between Austria and Algeria.
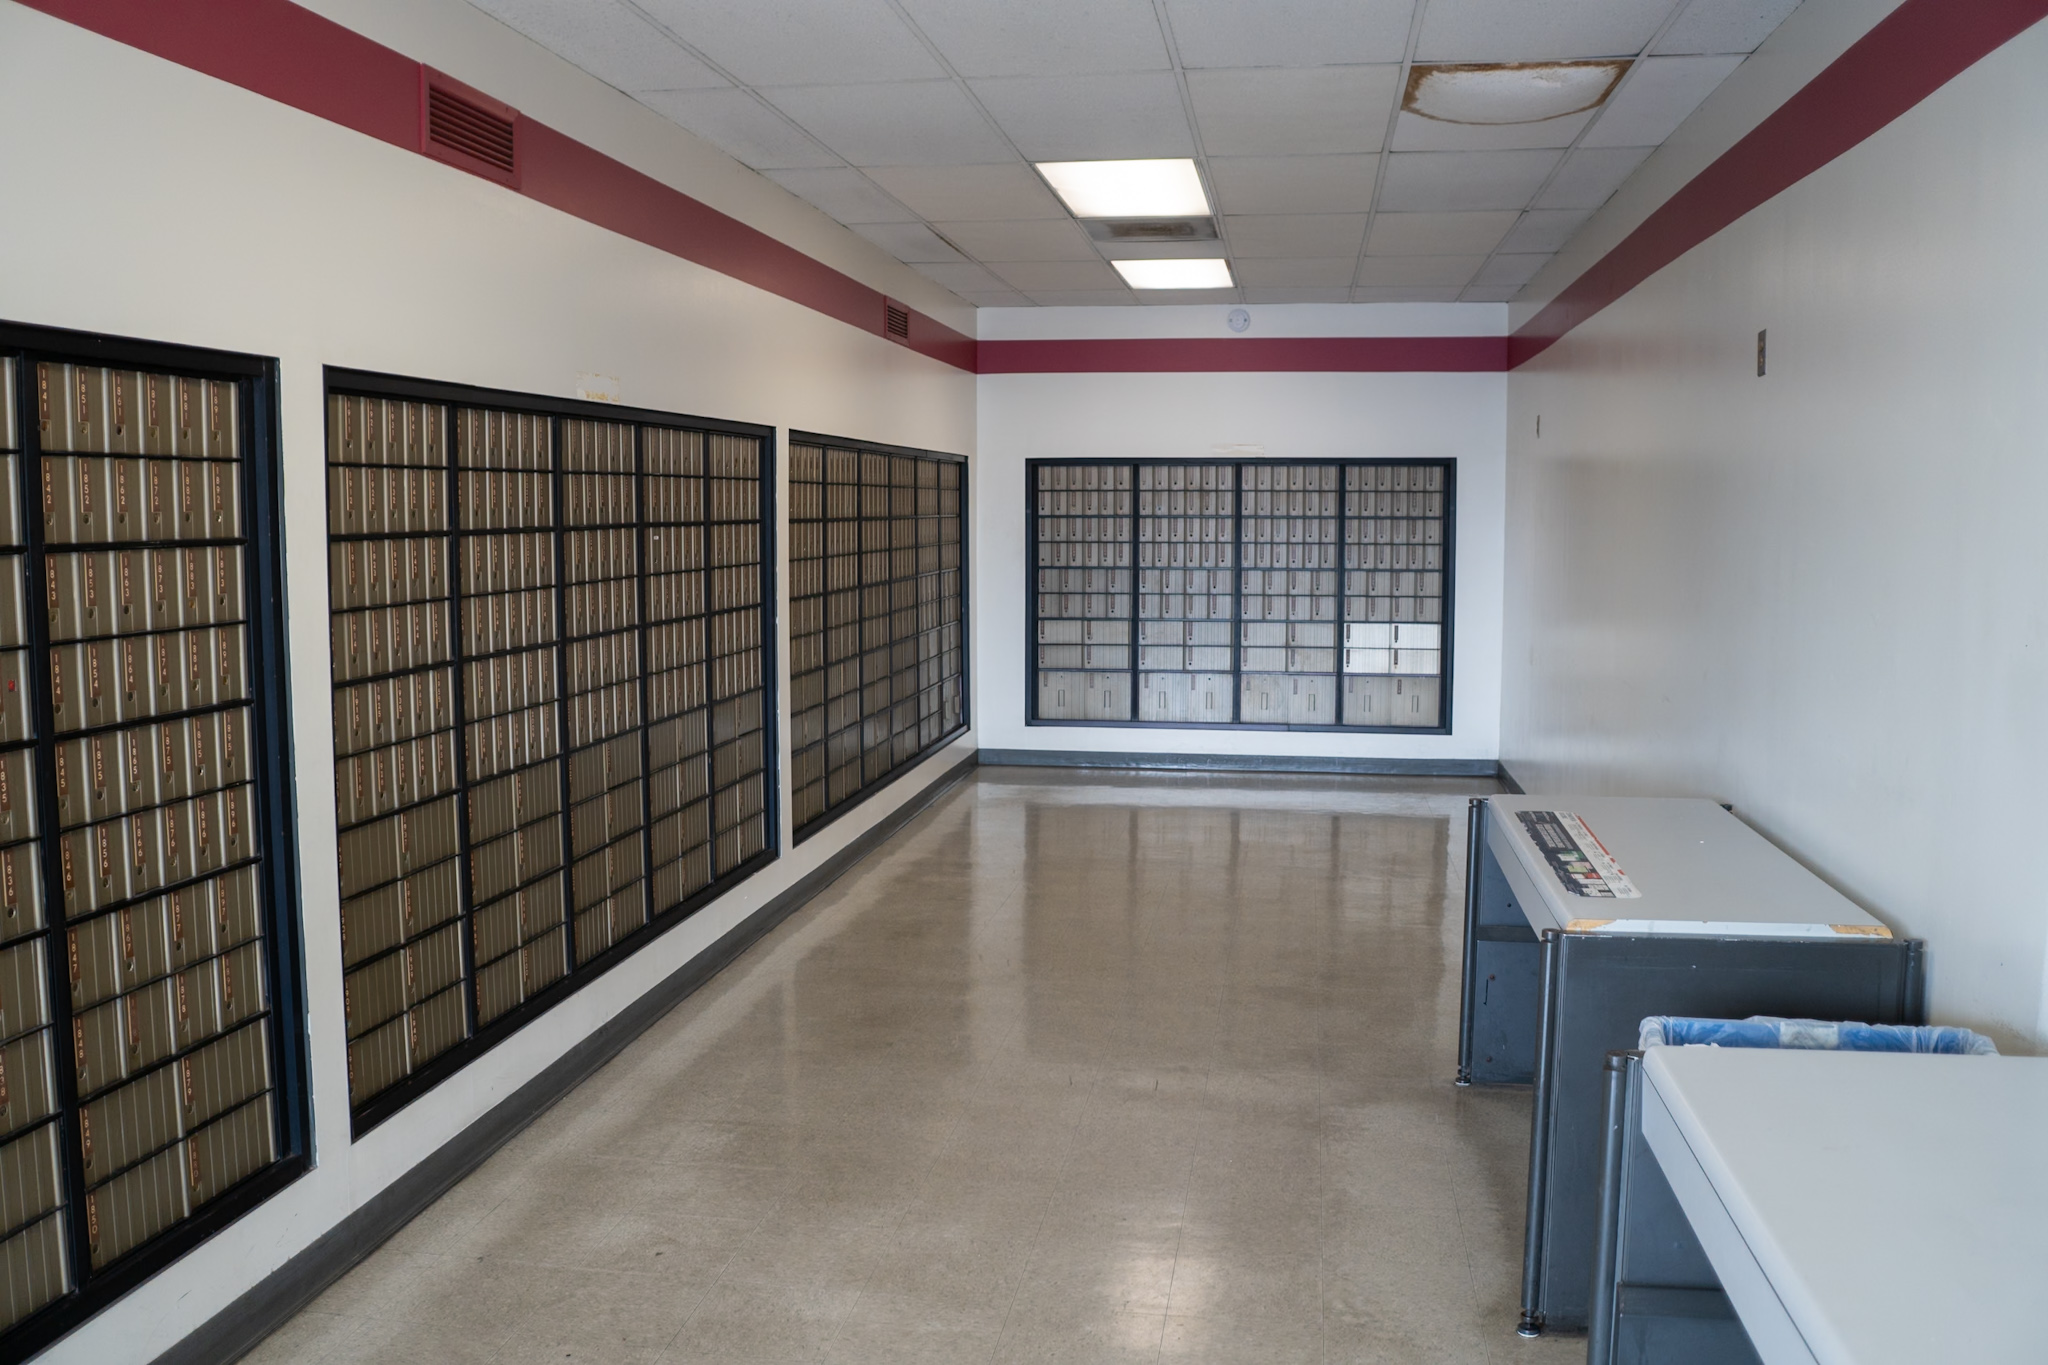
I rent a post office box. It is an unnecessary expense, but I enjoy a walk
every now and then to pick up the mail. My youngest child often joins me. He
enters, takes a big sniff, and tells me it is his favorite smell. It smells
like mildew.
If my 7-year-old ever sees me “hacking,” that is, typing terminal commands, he asks to help, which means me transcribing commands for him to type.
I started to explain IP addresses to him after he configured part of the network, but he told me he knows what an IP address is, he saw it on Magic School Bus.
With my new homeserver, I’ve made some changes (improvements,
hopefully) to my backup system.
Previous backup systems
To back up my Mac, I’ve always started with Time Machine. It has good
operating system support, and it can do frequent incremental backups, even when
you aren’t connected to the backup disk. It isn’t great for long-term backups
though, because every year or so, it gets corrupted and you have to start over
from scratch, losing old versions of your files. It seems to be worse when
backing up over the network, so I only use Time Machine to a directly
connected hard drive.
I’ve used Backblaze, which does internet backups. You can also configure
it to keep old versions of your files, although beyond a certain point you have
to pay per gigabyte. Backblaze has been pretty reliable, although if you have
multiple devices, the per-month price starts to add up.
I’ve used Arq, backing up either to a network drive or to Backblaze B2.
This seems to work pretty well. The concept is very similar to Backblaze except
that it is more flexible on where you put the data. I don’t use this on my main
machine any more, but my kids do on their laptops because it is good about
sending data over the internet to my home server (using RustFS to
run an S3-compatible server).
ZFS network backups
All of these backup systems do somewhat complex things to allow you to store
multiple versions of files, which is a very important feature for a backup
system, in case you accidentally delete or change something and you want to get
it back.
A different strategy is to make the backup client dumb but the storage system
smart. Since I’m using ZFS for my home server, I can do snapshotting and
versioning there. Not only does this simplify things for the client, it gives
me more flexibility, for example, to keep many snapshots on the large home
server but only send one or two versions to the smaller offsite backup drives.
SuperDuper
SuperDuper focuses on exact copies of the entire filesystem. It typically
uses an APFS-formatted external drive, but it also has support for network
shares. As of MacOS 26, these network backups use Apple’s new sparse image
(ASIF) format. On the server side, this looks like a giant file big enough to
store all of your data.
After each backup, I have SuperDuper trigger a ZFS snapshot, which allows me to
travel back in time to see a day’s backup even after future SuperDuper “Smart
Updates” have changed the live version of the sparse image on the server. And
ZFS doesn’t have to store an entire copy of each sparse image, just the parts
that have changed from one instance to the next.
You don’t get a fancy browser that can see all former versions of a file, the
way that Time Machine does. From MacOS’ point of view, you have an entirely
separate sparse image per backup, just stored in a way that they don’t have to
duplicate unchanged data. You do get all of the Apple-native file features,
since the backup targets are full APFS filesystems.
Carbon Copy Cloner
Carbon Copy Cloner is more flexible when making copies to an attached
hard drive, including using APFS snapshots to store multiple versions of a
file, the way that Time Machine does. But it is much more limited when using
network storage: it copies individual files and doesn’t support versioning
or other APFS features.
I find it useful, especially when combined with ZFS snapshots, because it makes
it easy to see a file’s change history over time. It is more transparent than
sparse images, even if it is less faithful.
Backups of a ZFS system
I also want an offsite backup, to make sure that I’m safe in case both my Mac
and home server are taken out at the same time. For this, I use an old hard
drive big enough to store just a few of the latest snapshots, and a Perl
script called syncoid (part of the snapshot manager sanoid).
The first time this is run, it creates a snapshot of the ‘main’ dataset
and then copies that snapshot to the offsite dataset, which is stored
on the external drive. The identifier is used as part of the snapshot name,
in case you want to set up multiple backup targets.
On subsequent runs, it creates a new snapshot, and then sends everything
that has changed since the previous syncoid snapshot (including any snapshots
that you make by other means) to the backup target. Then it deletes the
previous snapshot.
Compression is turned off because I am copying to a USB hard drive, not over
the network (although syncoid will work over SSH as well). The ‘w’ option
sends raw encrypted datasets, which isn’t strictly necessary since you can
always configure the target to re-encrypt everything. Deleting the target
snapshots means that if you delete a snapshot on the source, it gets
deleted from the target.
I keep two identical backups, one connected that is receiving daily syncs, and
the other at my office. Every 2-3 weeks I swap them, so that the office copy
isn’t more than a month out of date.
Earlier this year, I built a new home server and data storage system. From
the hardware side of things, this was a whole new experience for me. But the
software side also gave me a lot of opportunities to experiment.
Synology, TrueNAS, Docker, etc.
My previous storage system was Synology, which is appliance-style
software. The operating system is set up to be mostly foolproof, and additional
software generally requires applications to be packaged specifically for
Synology.
It is very convenient to have so many decisions made for you, and my original
plan was to use TrueNAS as a replacement. Like Synology, TrueNAS has a
web-based UI to manage the core services, and an app store to download
additional software, all very connect-the-bricks. And if you can’t find an app
you want, you can configure anything by using Docker.
The more I considered it, though, the more I realized that I didn’t want the
limitations of being inside an opinionated system. When everything goes right
with appliance-style software, it’s great. But if you veer too far away from
the defaults, or if you run into problems, you find yourself fighting against
the system instead of working with it.
Even Docker, which can make handling multiple services and dependencies both
easier and more reliable, adds a level of complexity that can be a drag.
Besides, I spend my time professionally running containerized, productionized
services, writing config files that are used to generate other config files
that eventually run and manage the services.
Bare metal
So instead, I decided to go bare metal, and I installed Debian. I have some
experience with this from my Mini PC that I was using to complement the
Synology. It is very common for software to have a Debian installer. And it
isn’t too hard to write or change a systemd config file if you want to
install something more obscure or customize things a little. I think you do
need a better understanding of how the different parts of the system work
together, but as a result, I feel like there is no magic, which means there is
no limit to what I can do.
Void Linux
And then, mostly by chance, I stumbled into a Linux distribution called Void
Linux. I was most intrigued by its service management system, which is
called Runit, because instead of config files it has shell scripts. I don’t
have anything in particular against systemd, but if my goal in going bare metal
was to get rid of abstractions and config files, then this seemed like an even
better fit for my hobby project.
One downside is that not as much software is packaged for Void compared to
Debian. And I probably wouldn’t recommend Void to someone who isn’t comfortable
with or willing to learn to write shell scripts. Also, setting up Runit
services can involve a little bit of boilerplate, which some people (not me)
are allergic to.
But if you clear those hurdles, the simplicity is your reward. The system boot
scripts are just shell scripts. Service definitions are just shell scripts that
are auto-restarted every time they terminate or fail. Instead of a complex
dependency management system, your service can just quit if something is
missing, and the next time it starts, maybe things will be in a better state.
Instead of writing a config file to create a custom /run directory or /tmp
directory, you can just put a mkdir inside the shell script. To enable or
disable a service, you put a symlink into the /var/service folder. To write
logs, you just print messages to stdout. And so on.
Anyway, that is the current state of my home server. It feels light and fun and
unixy instead of cumbserome and enterprisey.
I was playing around with IPv6 on the VPS that hosts this blog when I realized
that, at least over IPv6, I no longer need virtual hosts.
In the old, old days, a “host” was a physical computer name, mapped to an IP
address by DNS. As HTTP spread, it made sense to host multiple websites on the
same machine, so browsers were required to send the “Host” header to tell the
server what site they were looking for. Now a single server could do something
different in response to www.example.com vs example.com.
Today, the vast majority of the web is served through a Content Delivery
Network (CDN) such as Cloudflare, where millions of sites are assigned to the
same IP address, and the Host header is used to route the request through the
CDN to see if there is a cached version, falling back to the “origin” server if
not. At that point, the origin server is likely serving a dozen or more
sites, and it again looks at the Host header to actually figure out what
content to return.
In an nginx config on the origin server, this might look like this:
server {
    listen 80;
    listen [::]:80;
    server_name example.com;
    ...
}
This says “use the following settings if you get any request on IPv4 port 80,
or IPv6 port 80, as long as the host matches example.com.”
The server that hosts this blog hosts a dozen others, many of which are just
redirects like www.nathangrigg.com -> nathangrigg.com. Until today, these all
used the same IP address, with an nginx config to route the different virtual
hosts to different sites on the same server.
While I wouldn’t want to pay for that many IPv4 addresses, which typically cost
a couple dollars each per month, IPv6 addresses are plentiful. My host will
give me, at no charge, a “/64 block”, meaning a 64-bit prefix for which I can
use every address contaning that prefix. Since IPv6 address are 128 bits long,
that is 2^64 possible addresses to use.
So I added a startup script on my server that runs
ip -6 addr add 2a01:7e03:e001:1ac::1/64 dev eth0
ip -6 addr add 2a01:7e03:e001:1ac::2/64 dev eth0
...
(That is my assigned 64-bit prefix in four groups of 16, and the double colon
means “a bunch of zeroes”.)
Then I updated my DNS entries to map each domain to a different IP address, and
updated my server block to say
server {
    listen [2a01:7e03:e001:1ac::1]:80
    ...
}
(I had to keep a separate server block with virtual hosts for the IPv4-based routing.)
Now, over IPv6, nginx uses the incoming address rather than the host name to
decide what to serve.
Is it better? Probably not. But it lets me pretend like I have a different
computer for each little website.
If you want to see it in action, try curl -vIL6 www.nathangrigg.com, and you
can watch the procession from www-port-80 to www-port-443 to bare
nathangrigg.com. (v for verbose, I for headers only, L to follow
redirects, and 6 to force IPv6. If it fails for you, you may have to remove
the 6 and watch the boring IPv4 version, where the IP address is the same for
every request.)
I like having network-based storage, so I can have a place to store backups,
large files that I’m not using, copies of media that I’ve purchased,
audiobooks, etc.
For the last 10 years, I’ve accomplished this with a four-bay Synology, which I
eventually replaced with a second four-bay Synology, keeping the old one as a
backup.
You can run various programs on the Synology because it is basically a
low-powered server. The UI was helpful for me as a beginner.
In the long run, however, I wanted more customization than I could get from
Synology, which eventually led me to buy a mini
PC to run everything except the
basic file server and backup functions.
Finally, I decided that I wanted even more customizability, I wanted a way to
put all of my drives in one machine, and I was itching for a fun side project. I
briefly looked into other network storage options and decided that, since I had
never built a computer from scratch before, it would be fun to try a custom
build.
Parts
I don’t remember exactly how it all came together. There are a lot of options,
a lot of decision to be made, and I didn’t really know what I was doing.
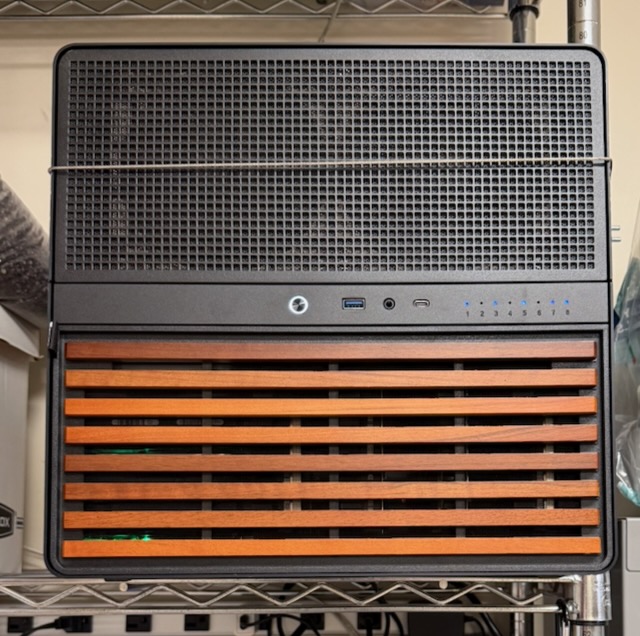
I wanted room for a lot of disks and the ability to hot-swap, which led me
to the Jonsbo N5 case,
which holds 12 disks. It was great for a first build because it is quite
spacious.
I wanted a way to access it without a keyboard or monitor, so my main
requirement for the motherboard was something server-grade with
IPMI.
The motherboard I bought has a separate ethernet port that presents a web
interface to configure the firmware settings as well as to connect remotely to
a virtual monitor.
I wanted a CPU with integrated graphics, and I went with a mid-line Intel chip
(“Core Ultra 5”).
I also needed a host bus adapter
to be able to connect so many hard drives to the motherboard. This goes in a
PCIe slot.
Finally, I wanted ECC RAM (very expensive thanks to AI), and some SSDs to run
the operating system. Plus a power supply, a bunch of cables, and some fans.
Build
The build was like an expensive Lego project except I might have bought the
wrong pieces. It really was fun to see all of the different pieces come
together.
I had a hard time getting the CPU cooler attached and I was worried I had done
it wrong.
I had some annoying fan issues because I had some giant 14-inch fans for the
front of the case that max out at 800 RPM. If they went below 300 RPM, the
motherboard would think they had failed and start pulsing all of the fans, or
else blowing them all full blast. I eventually solved this by connecting them
to a fan hub so that the motherboard wouldn’t know how fast they were going.
I’m sure there are better ways.
Those issues notwithstanding, I did manage to boot it up on the first try.
Unfortunately, I had a couple of suspicious crashes in the first few days,
mostly when I was transferring large files to the new computer. I realized that
before I started trying to install anything, I should have done some diagnostic
checks.
When I ran MemTest86 to check whether there were
RAM issues, it froze four seconds into the first test. It failed so hard that I
figured I must have done something wrong with seating the CPU, or that the
motherboard was faulty.
I tried reseating the CPU to see if I’d screwed it up, but eventually resigned
myself to buying more RAM. This was a painful choice because RAM was 1/3 the
cost of the full build. But it was the right choice; the new RAM passed
MemTest86, and I got a refund for the first batch of RAM.
So with that, I had a working computer. It was a really fun way to spend some
of my free time. I wouldn’t say it was easy or frustration-free, but I learned
a lot. It was also a good complement to my day job, where I wrangle computers
like they’re herds of cattle without ever seeing or touching a single one.
The computer sits on a shelf in the garage, with a cable around it for earthquake safety.
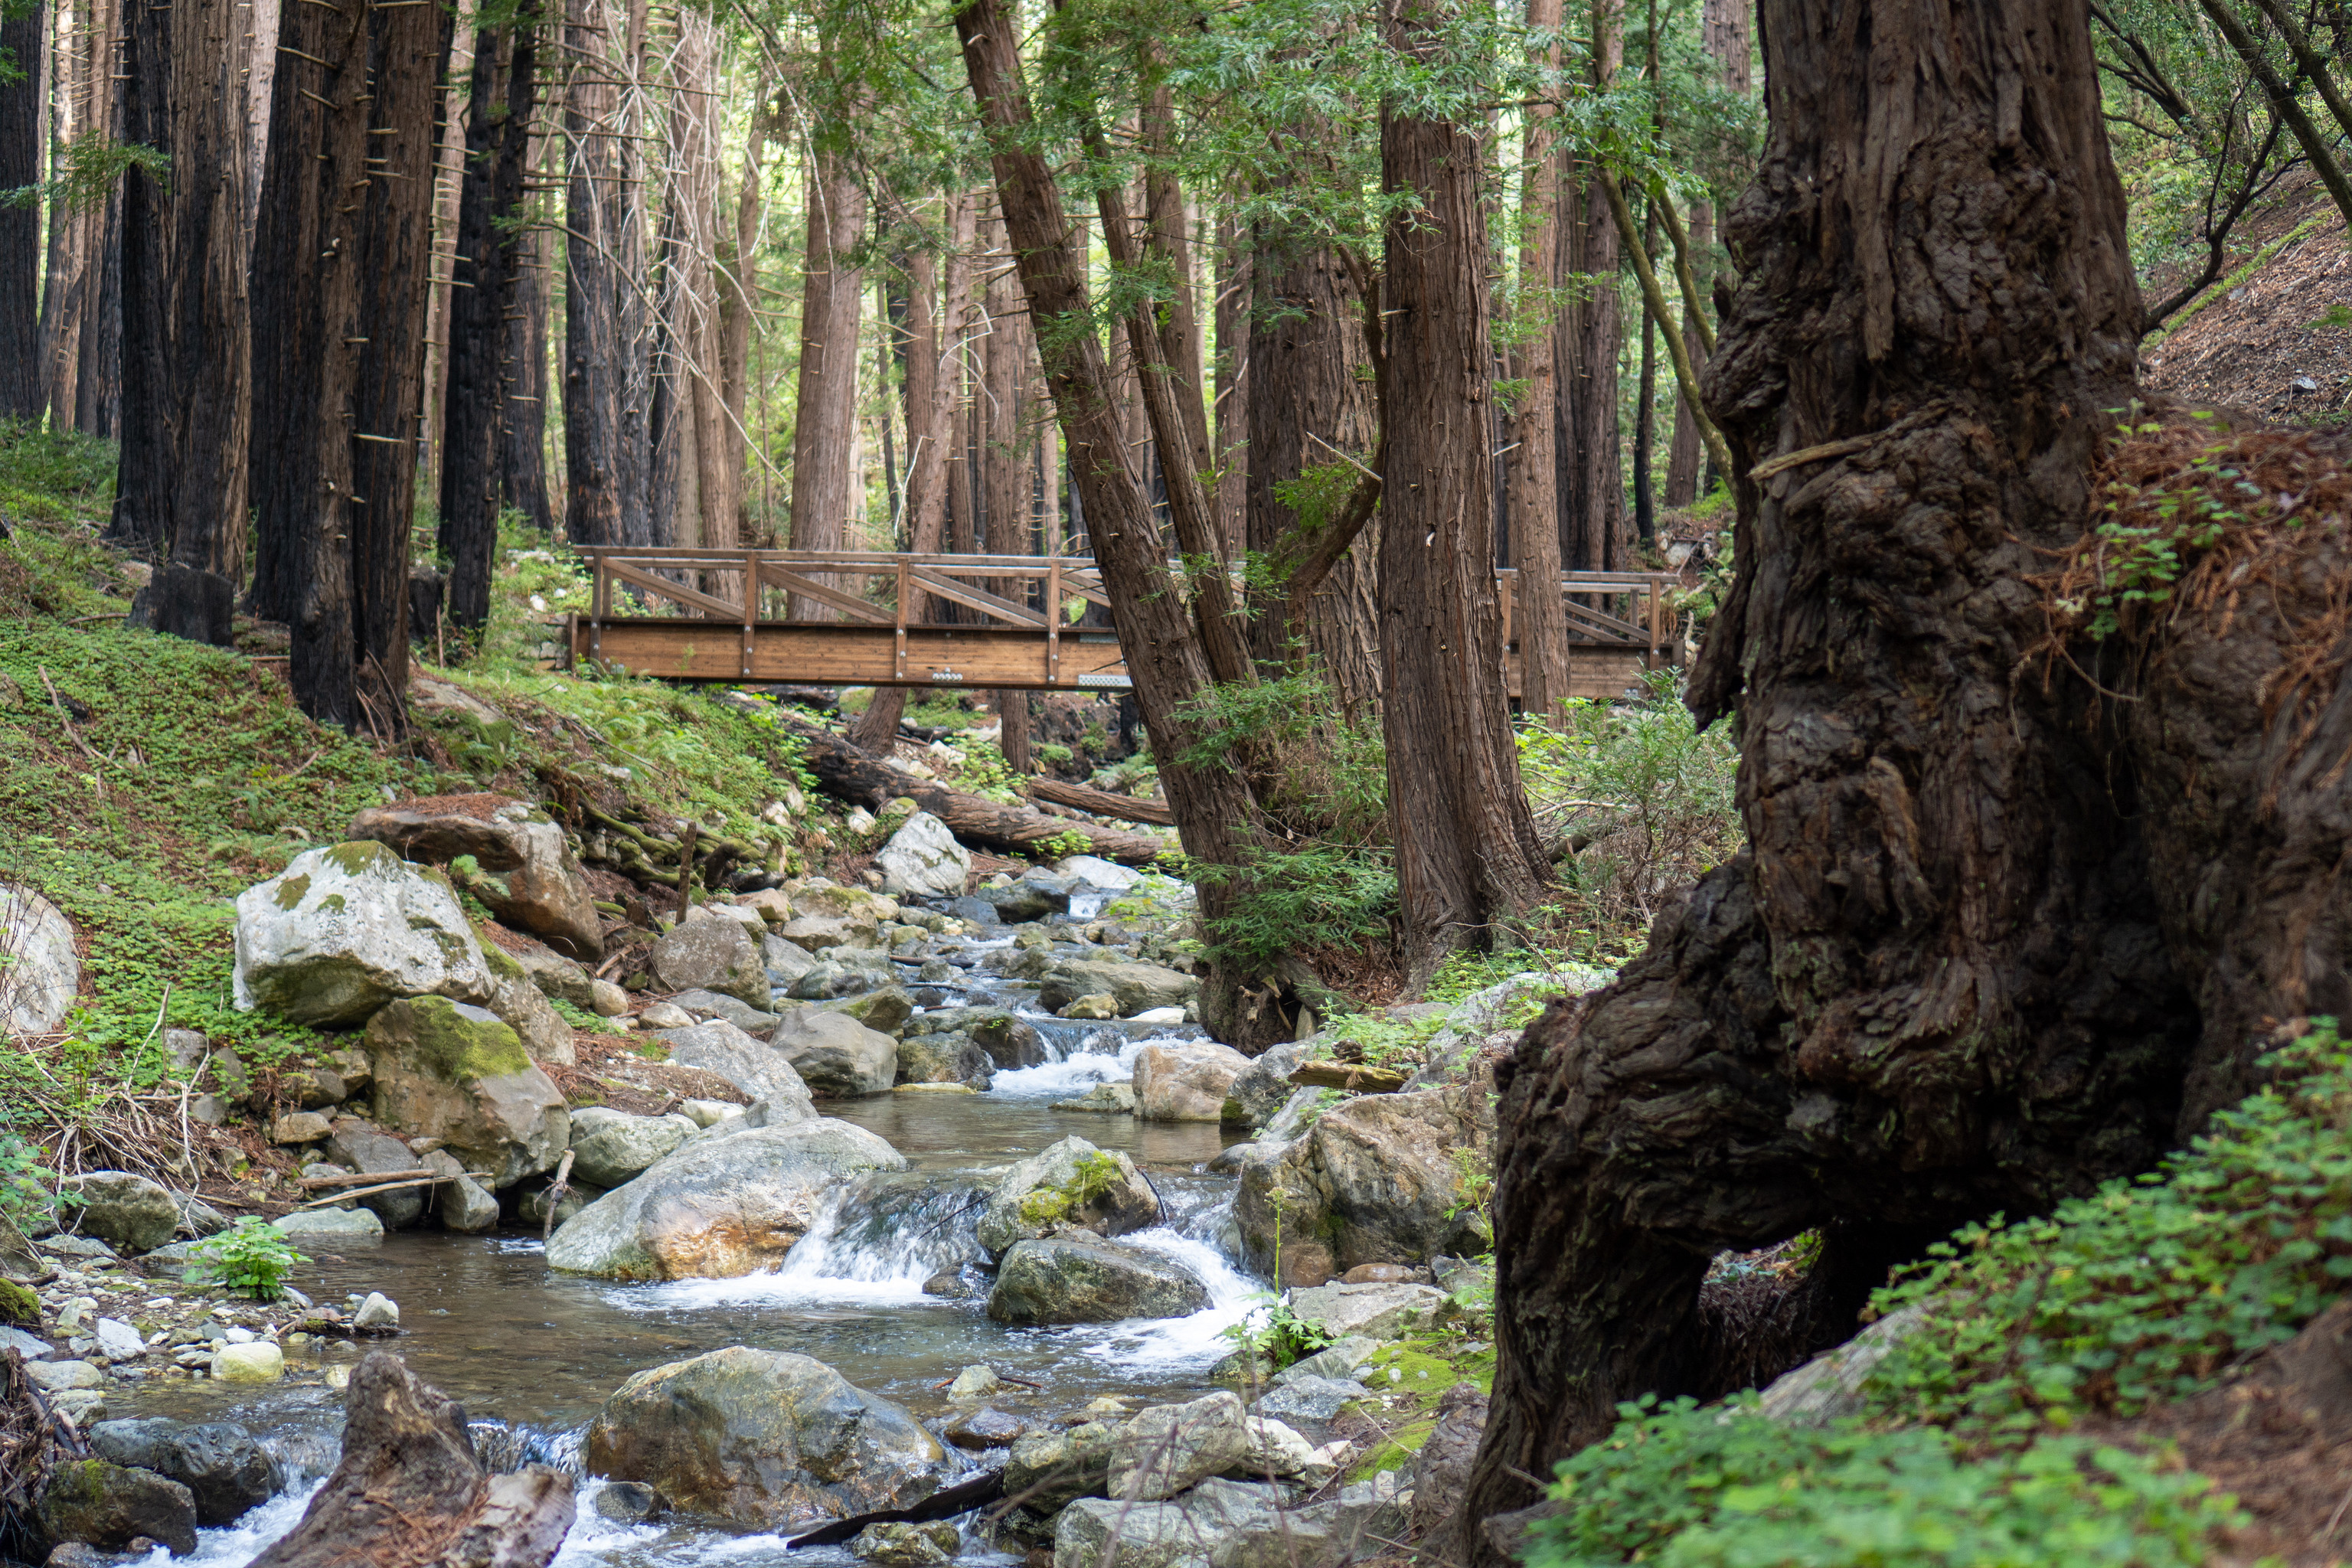
Julia Pfeiffer Burns State Park, Big Sur, California
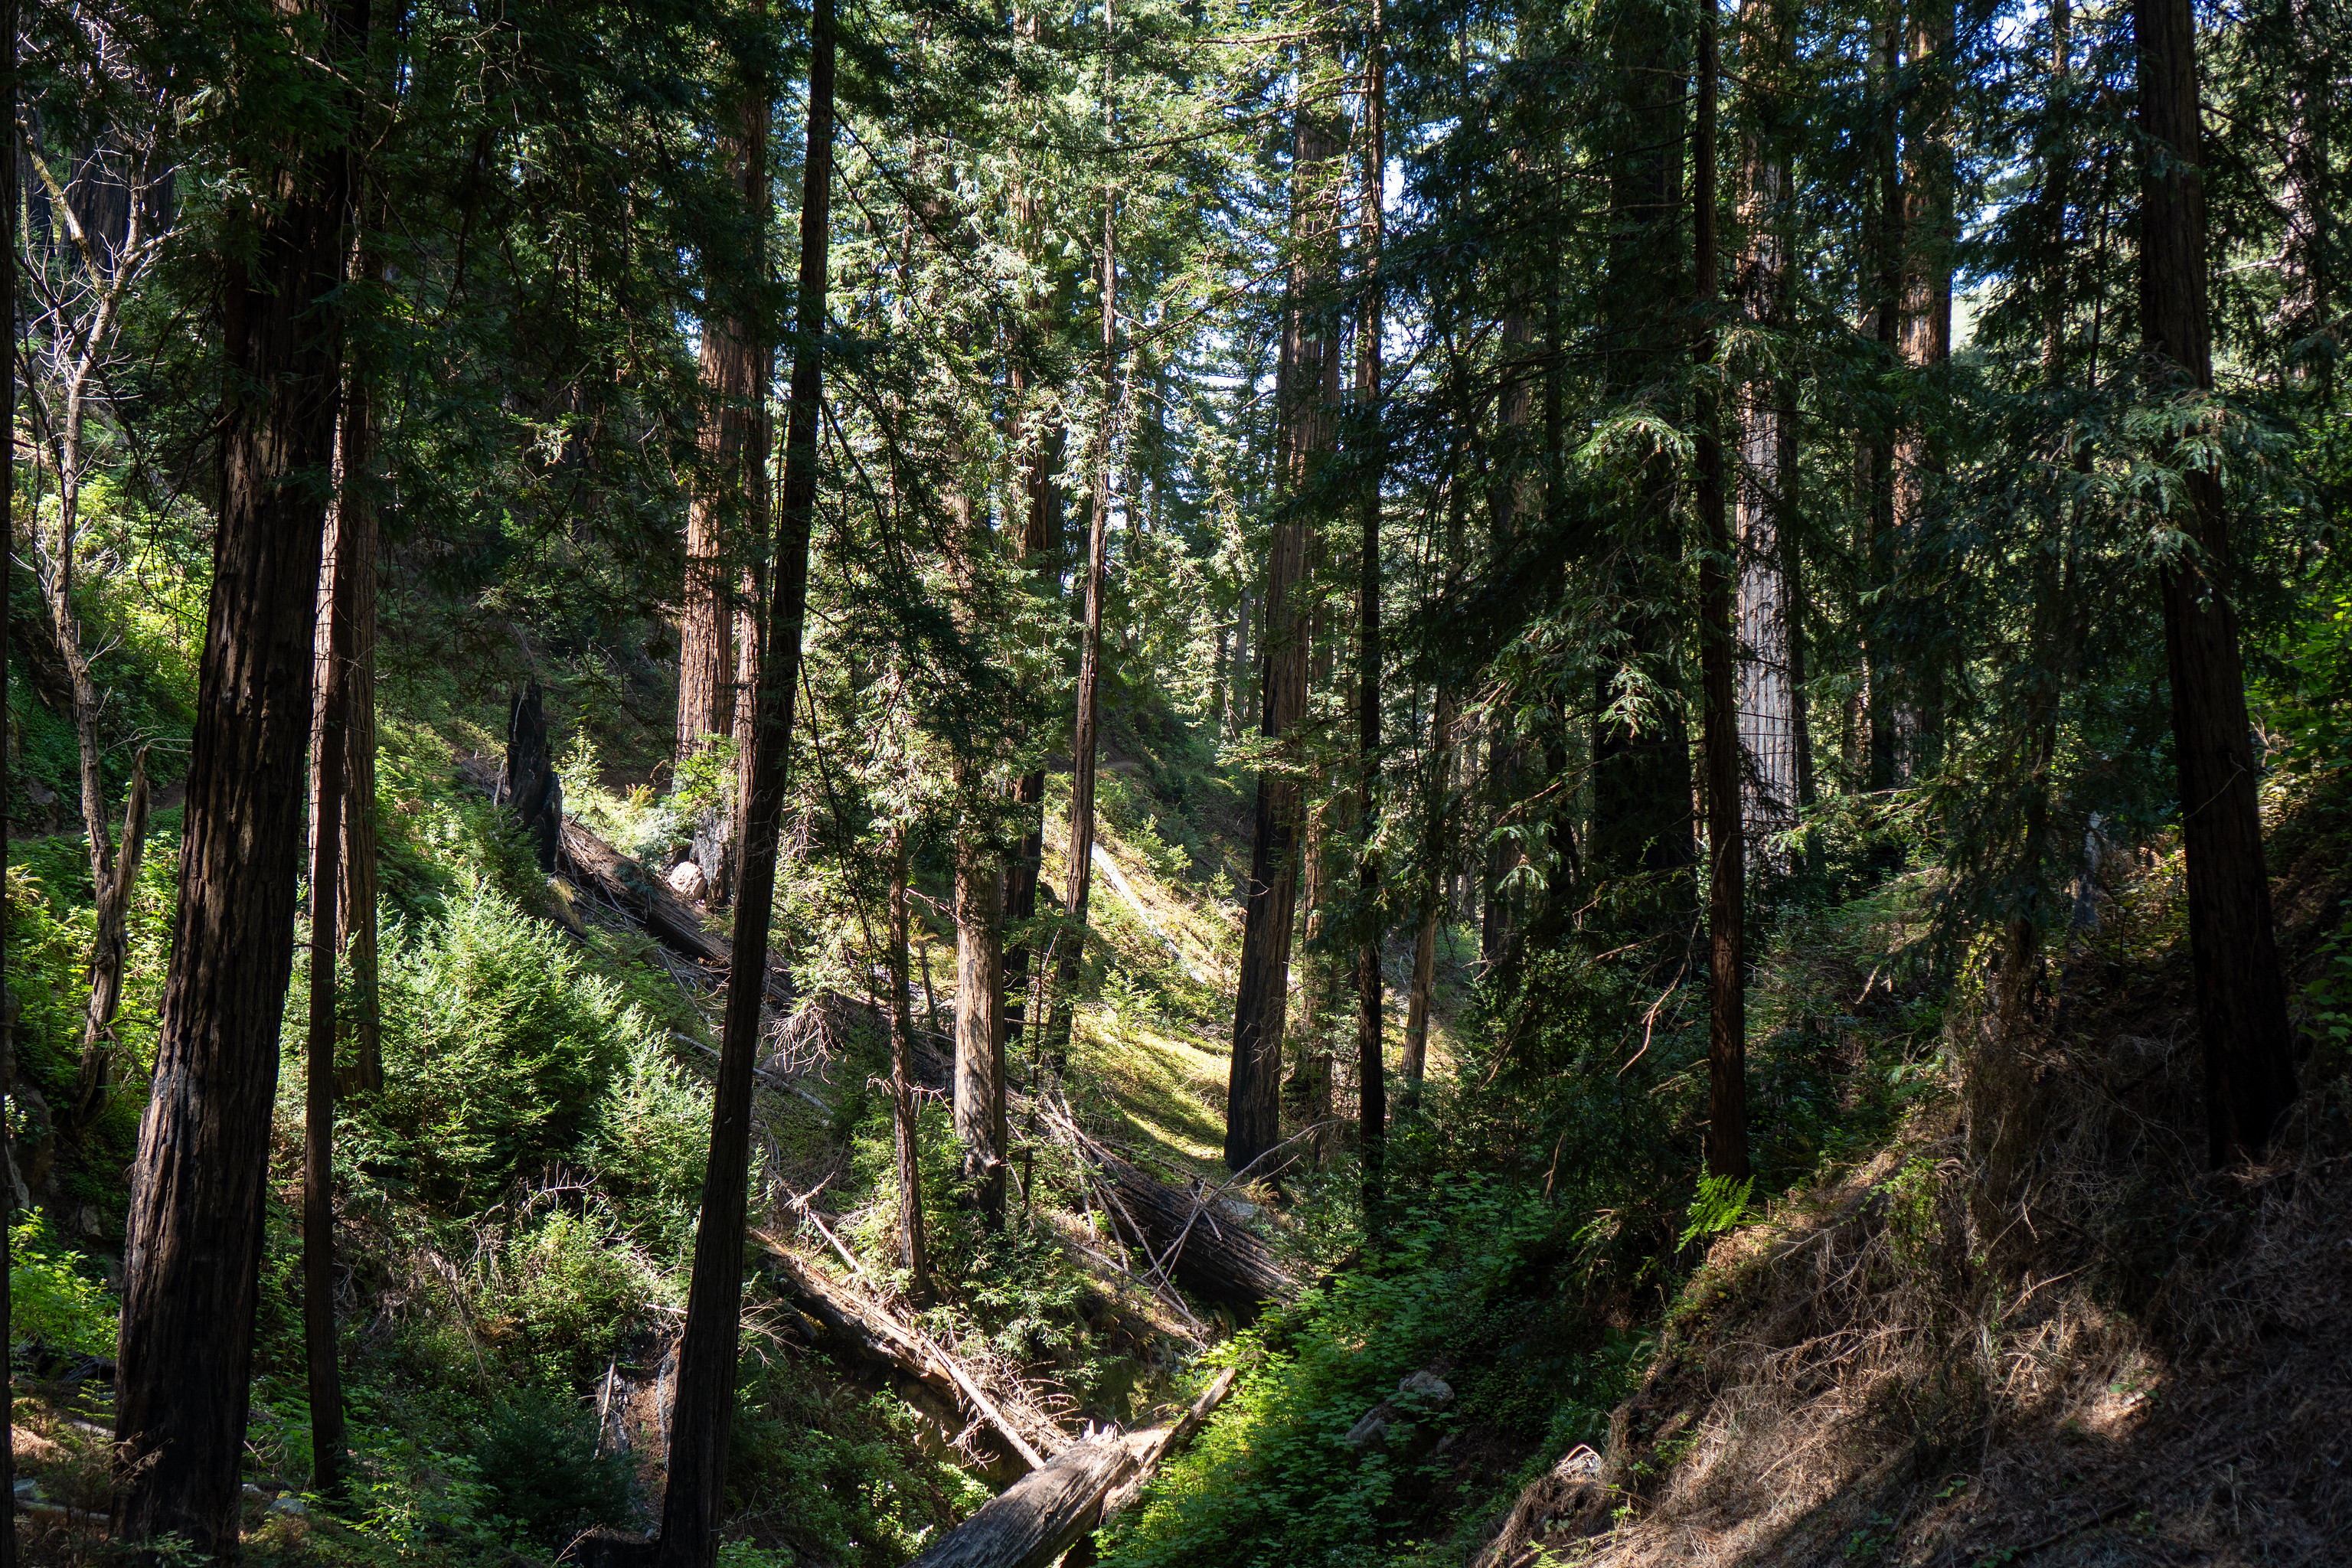
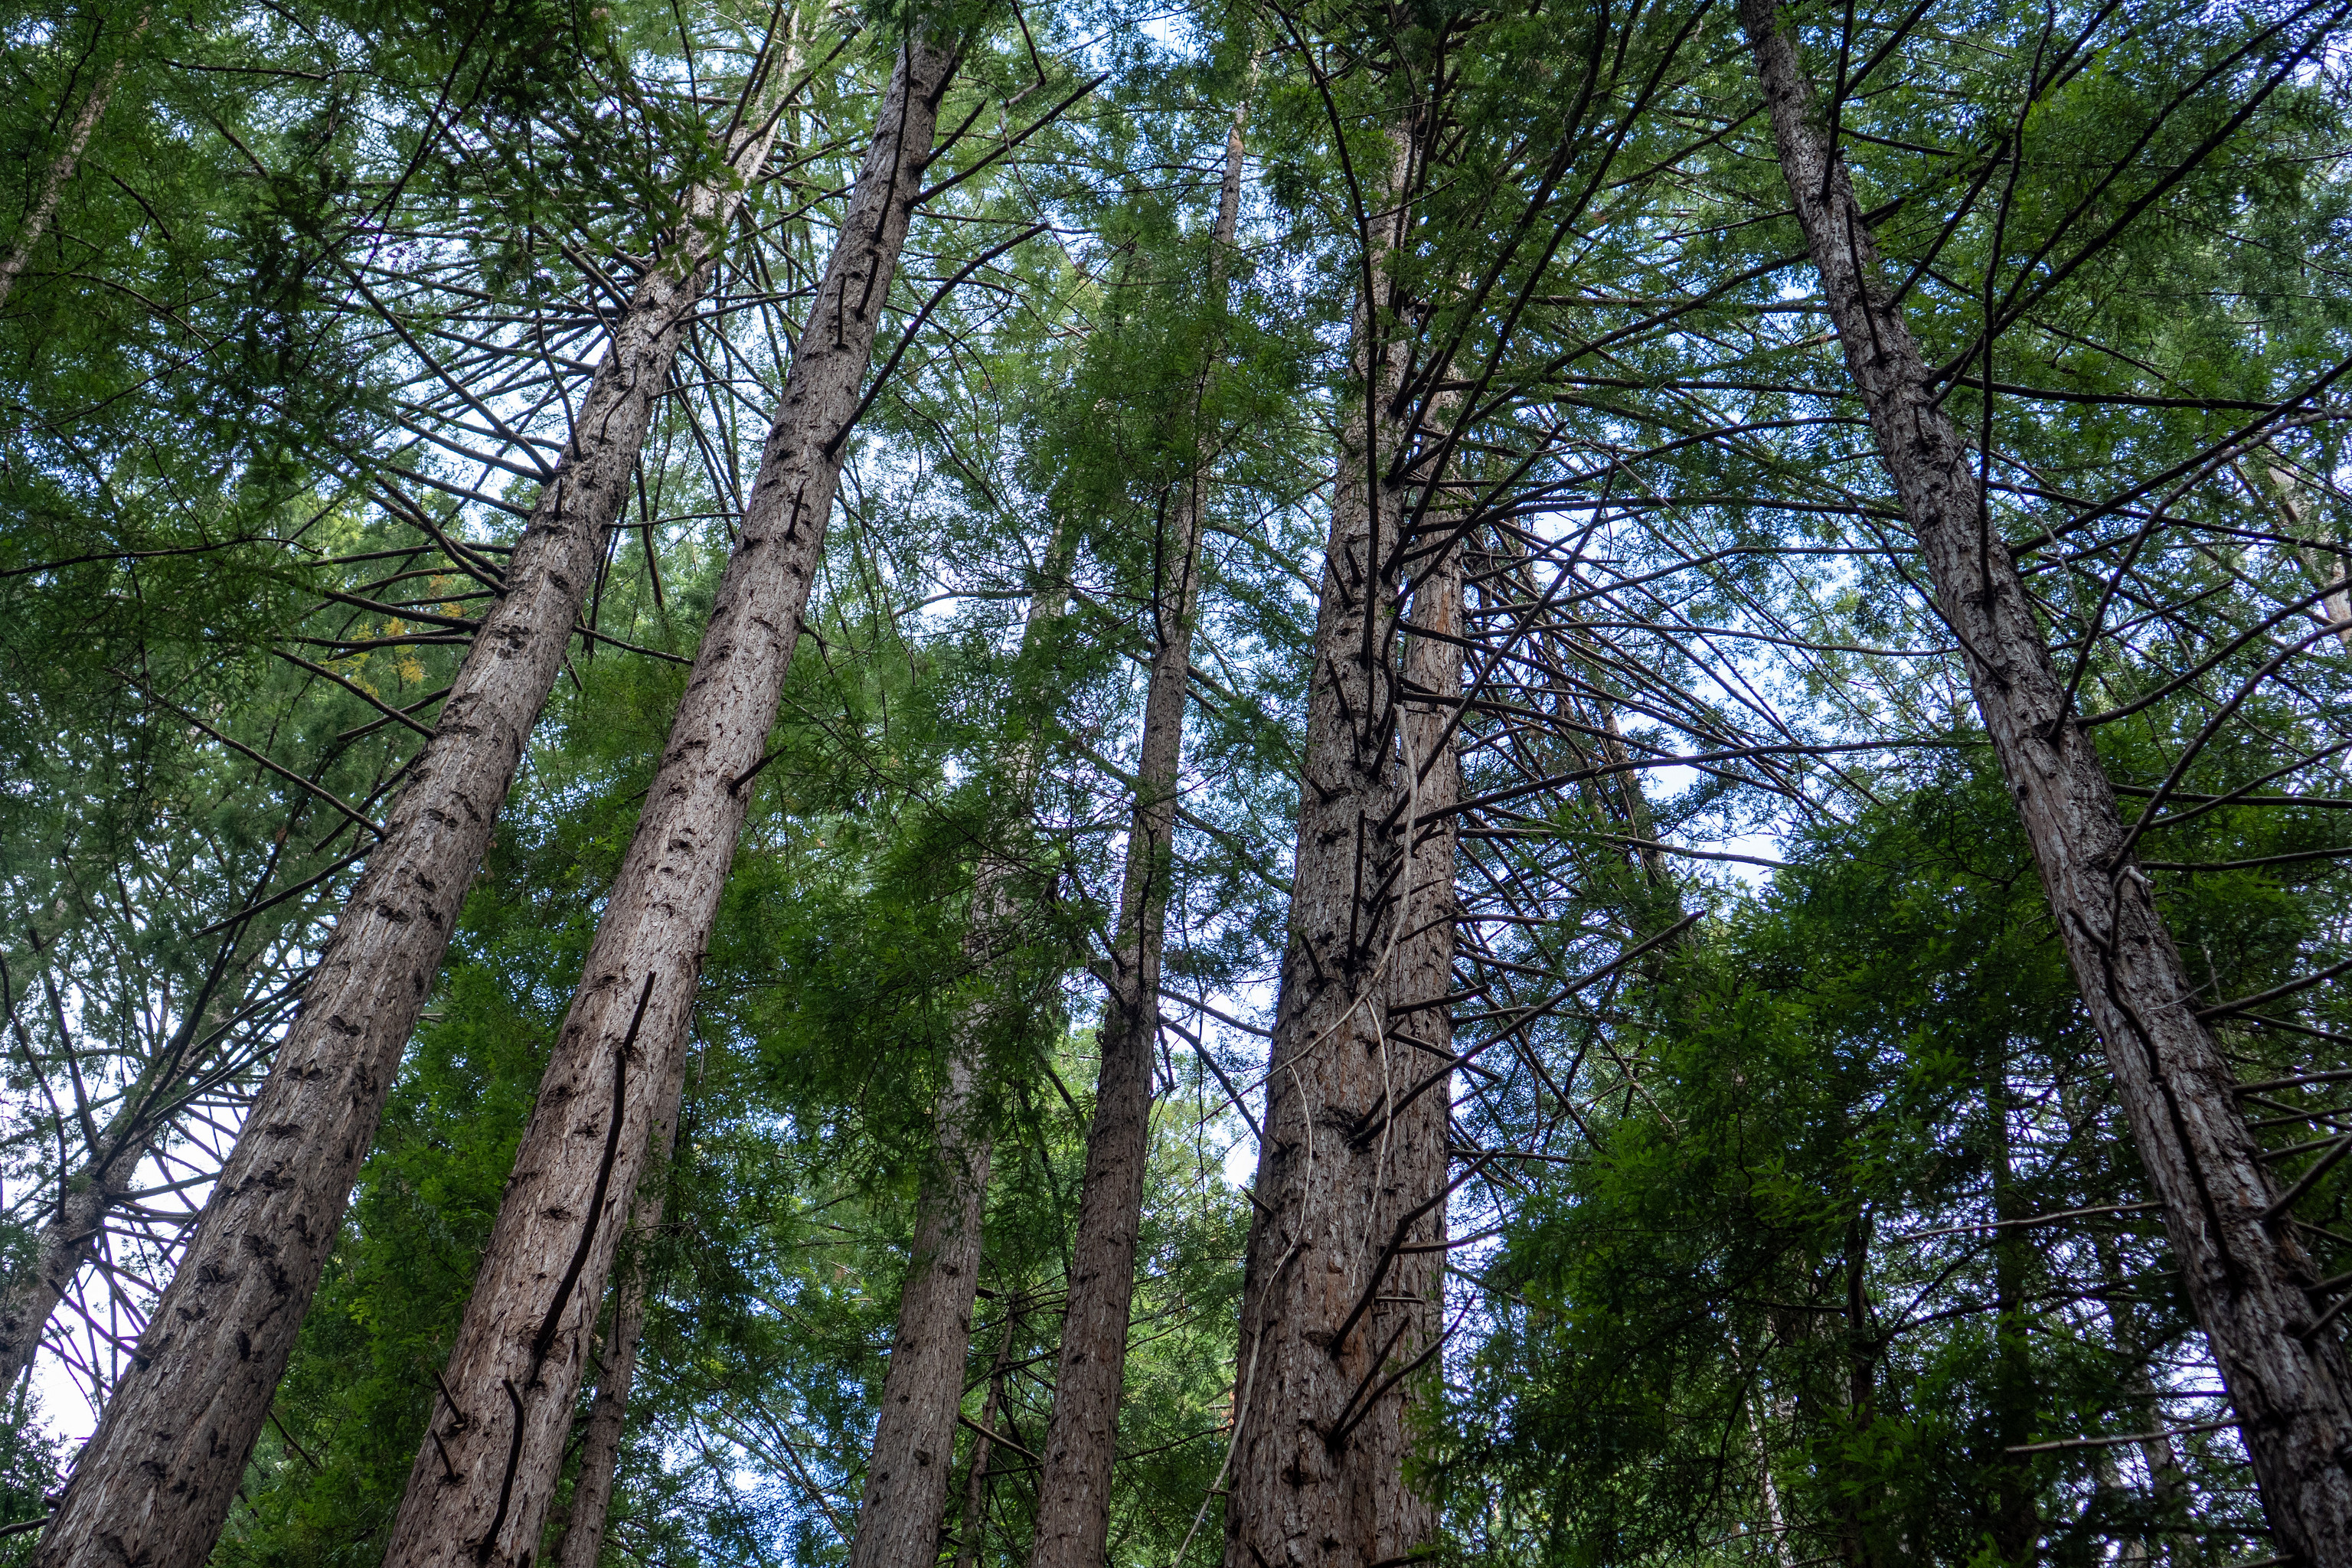
Limekiln State Park redwoods
Limekiln State Park near Big Sur, California.
Writing go code is a thousand paper cuts but then you get that nice beautiful binary and you put it wherever you want and I’m still not sure it’s worth it.
Well done Bruce Springsteen. I’m touched by the designation “Winter of ‘26.” Some events are too momentous for a descriptive label. Here’s hoping we remember it as a turning point, a wake-up call to the complacent.