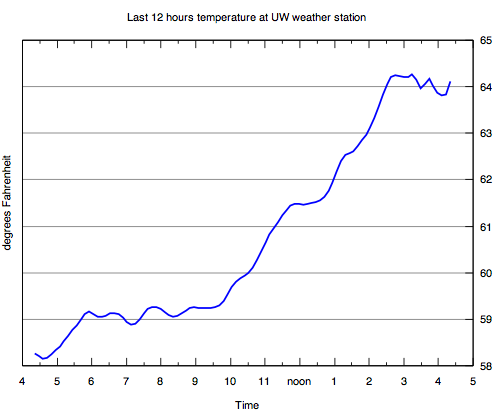
I am always a little disappointed when I look up the current temperature on the internet or a weather app. One number can only tell you so much about what’s going on outside. We try to make up for it by reporting the high and low temperature for the day, but there’s a lot more to a function than one data point plus two extreme values. Luckily the University of Washington records the temperature on the roof of the ATG every minute and allows you do download it in csv format. From there, a little messing with gnuplot makes it readable, and I really know what the temperature is doing. Here’s an example:
The Python script downloads the last 12 hours worth of temperature readings from the University of Washington weather station. The readings are available as a csv file. The script then extracts the useful information from the csv file and converts the times into a format that gnuplot understands. Also, it deals with time zone issues. It then feeds the data through gnuplot to draw the graph and outputs the graph to the user. It also caches the graph to prevent unnecessary strain on my or the weather station’s server.
The main plot command is
plot "-" using 1:2 smooth bezier lt 3 lw 2 notitle
The "-" means the data file will be given on stdin, but you could also use a filename here. The using 1:2 tells it to use columns 1 and 2 for the x and y data, respectively. Then smooth bezier tells it to smooth the data instead of just connecting all the dots. Color is controlled by lt 3 and line weight by lw 2. Counterintuitively, notitle eliminates the key.
Here is the entire gnuplot code:
|
|