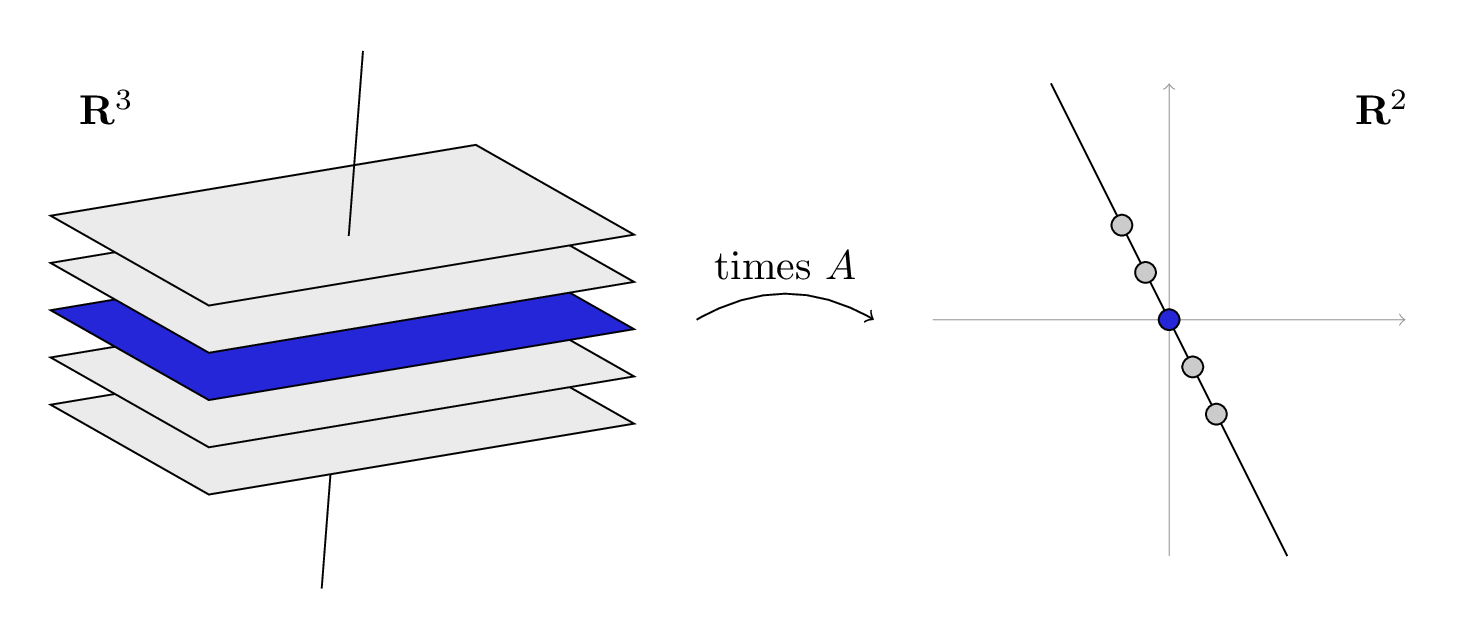
TikZ is a Latex package that lets you make graphics and diagrams. I have been meaning to check it out for a while now, but this week I finally had a need. Two days of class were cancelled last month due to snow, and the class I’m teaching to needs speed through some topics. So I made some notes for my students, and I drew this depiction of a linear transformation:
The advantage of TikZ over another drawing program is that it is easy to integrate it into a Latex document, matching fonts and font sizes. It is also very easy to include mathematical formulas in your drawings. And the input files are text files, which makes it easy to keep track of or share your drawings.
The advantage of TikZ over pstricks, which is another popular Latex drawing package, is that you can compile it straight to pdf, instead of generating postscript and distilling.
The code that you use to make a picture is very mathematical. This makes it a little difficult if you want to, say, make a new logo for your business, but for simple mathematical objects, it actually makes things easy. Here is an example of the code to draw one of the planes (which are, of course, actually parallelograms).
\begin{tikzpicture}
\draw[fill=blue]
    (-2, 0.6, 1.4)         % starting point
    -- ++(3.6, 0.6, 0)     % move along this vector
    -- ++(0.3, -1.8, -2.7) % then along this vector
    -- ++(-3.6, -0.6, 0)   % then back along that vector
    -- cycle; 			   % and back to where you started
\end{tikzpicture}
The minus signs tell it to make a path, and the plus signs indicate relative movement. The code for the entire picture is here.
TikZ also works great for diagrams. Having tried my hand at xypic and diagrams and amscd and probably others, I don’t think I’ll ever use anything else. If you want to see how to use TikZ for diagrams, check out this article by Felix Lenders.