Inspired by Dr. Drang’s plots illustrating the potential effects in Chicago of a move to permanent Daylight Saving Time in the US, I wanted to investigate which places would have the hardest time in the dead of winter.
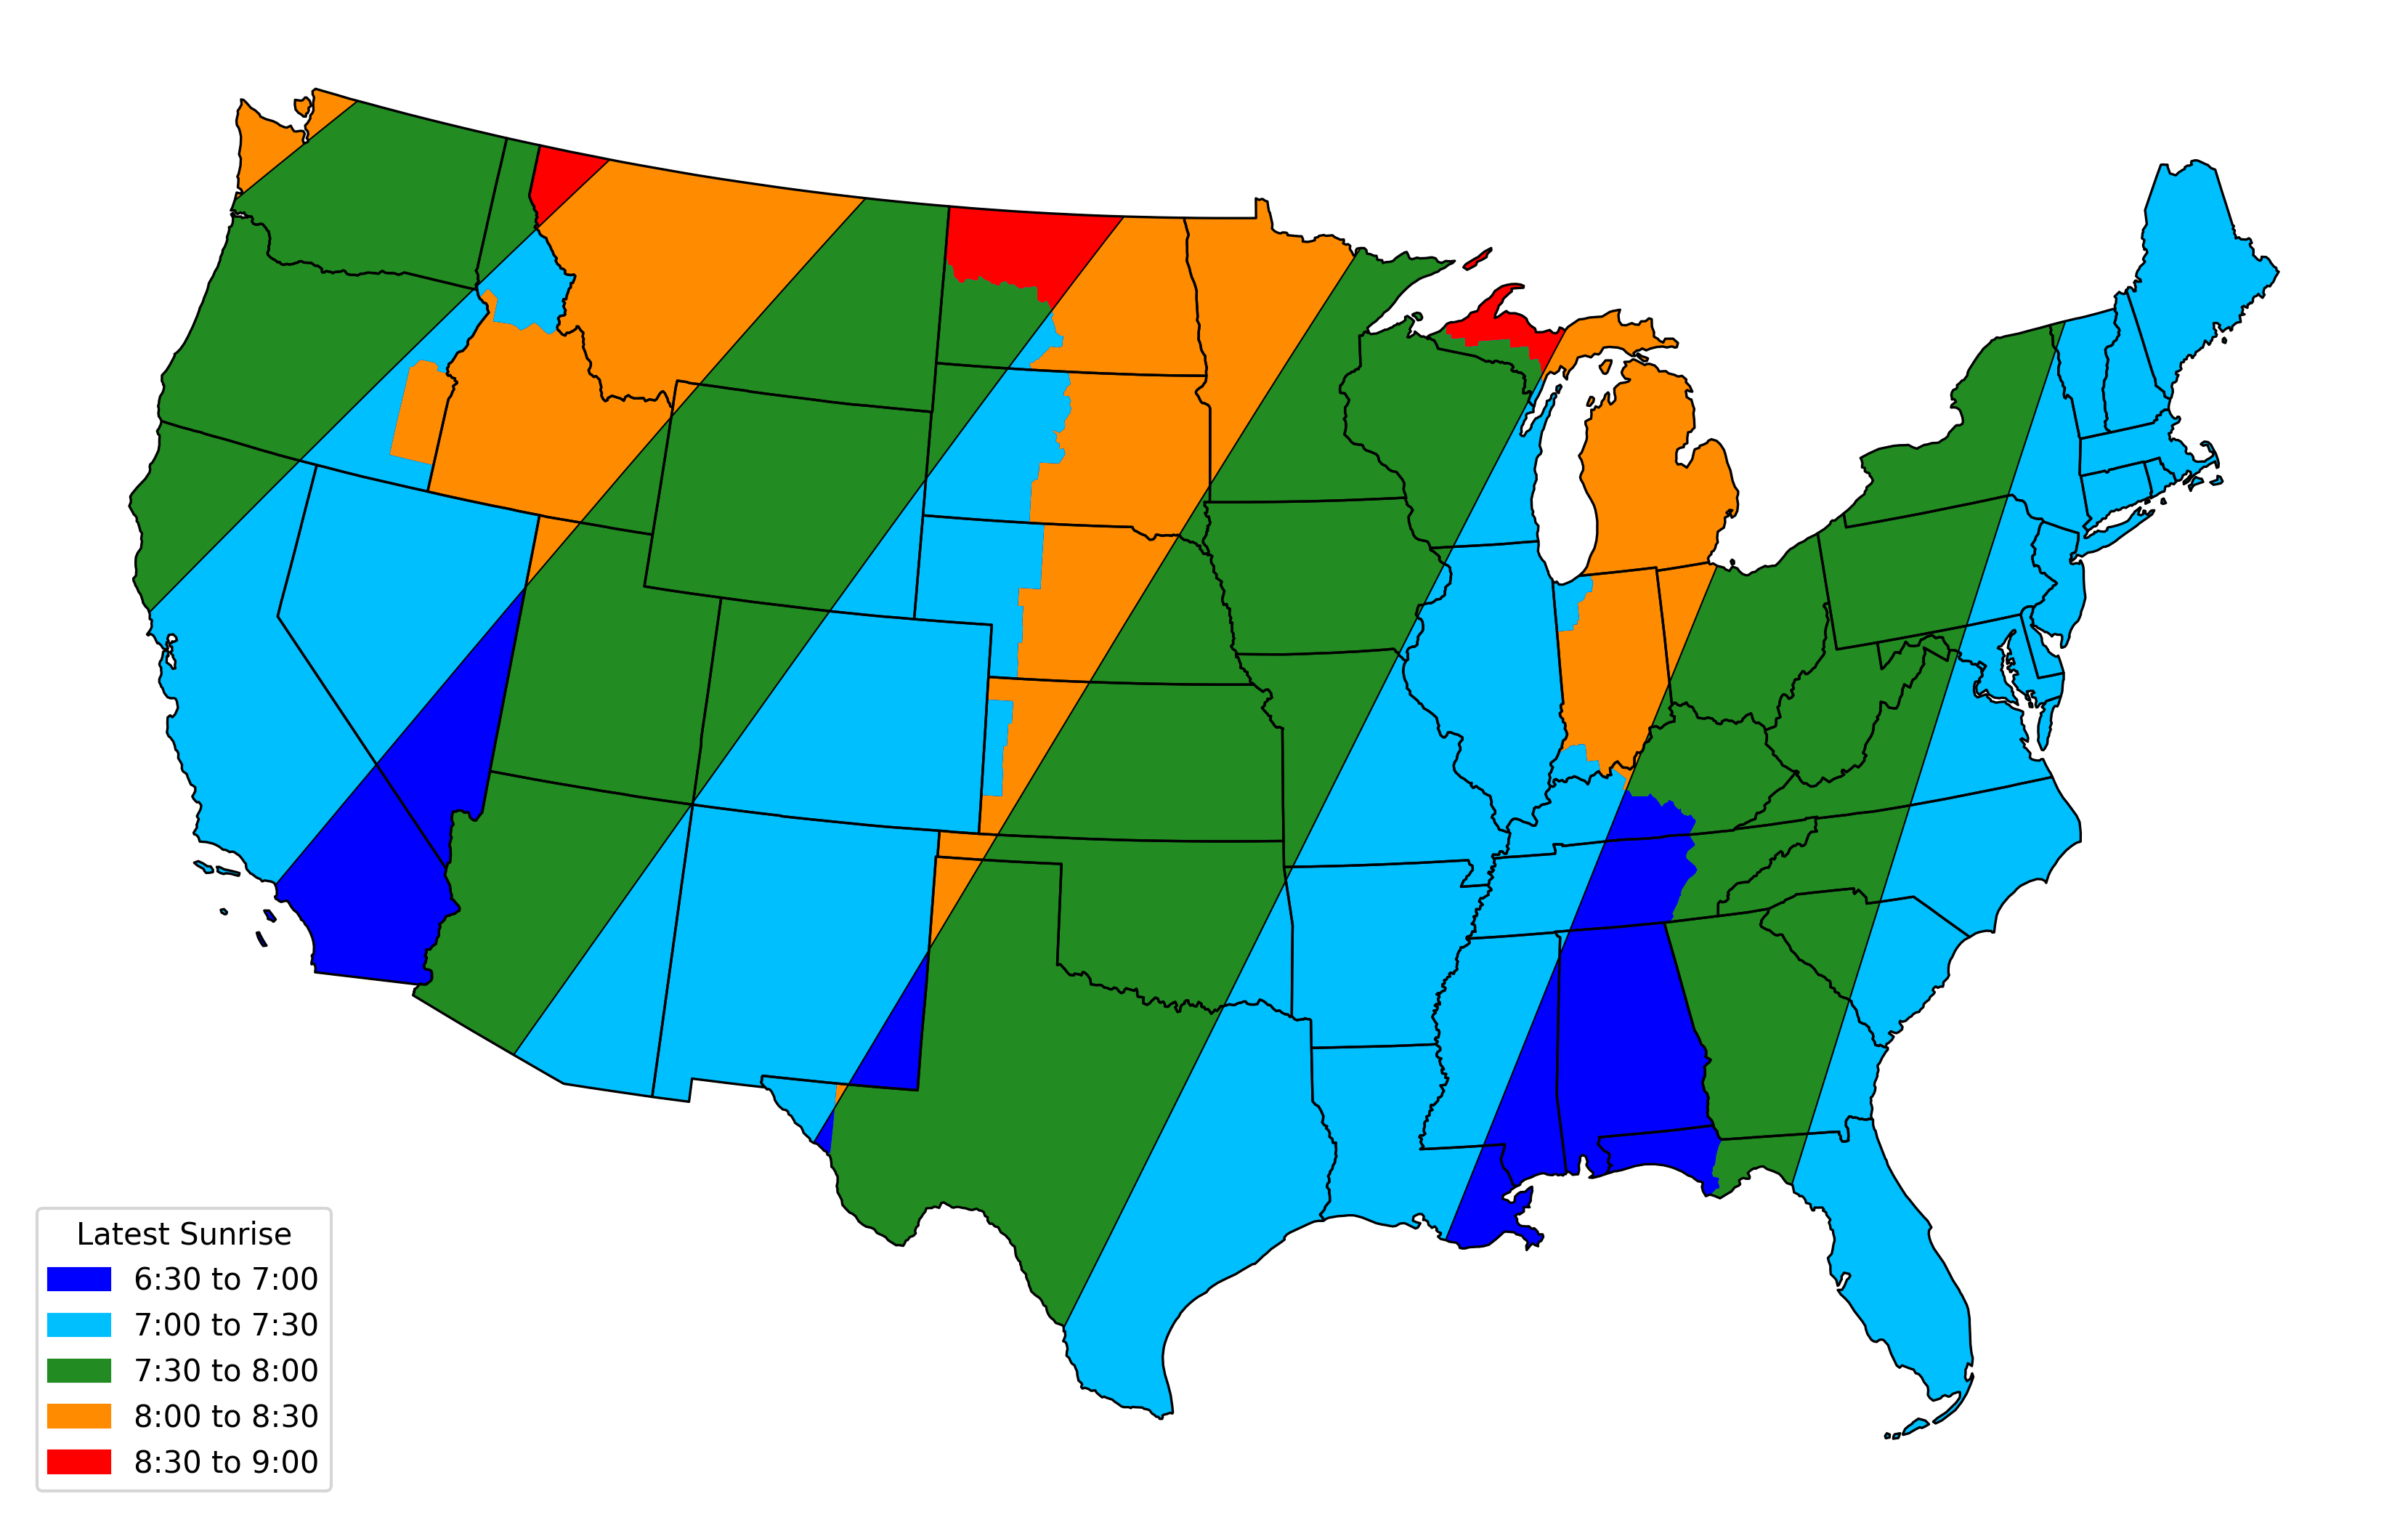
I ended up with this map of the USA Lower 48, with regions shaded by the latest sunrise time that occurred between January 1 and January 15, 2026.
If any location were to switch to permanent DST, their latest sunrise would be an hour later than shown in this map.
I have very little sympathy for the orange and red zones, which currently see their latest sunrise after 8:00 and would move to a post-9:00 sunrise. Parts of Washington, Montana, and Michigan are very far north and there is only so much we can do to help. In all other cases, you are in the wrong time zone anyway; this one is on you.
I do feel for the green areas, which are properly situated but would have to suffer through at least a few sunrises between 8:30 and 9:00.
Of course, I think it is silly to use permanent DST rather than permanent Standard Time. Sure, a lot of our habits have been built up around astronomical noon being closer to 1 p.m. for most of the year, but I’m sure we would figure it out quickly enough.
I’ll be fine either way, since I’m right on the boundary between dark and light blue. I would survive shifting our worst-case winter 7:00 sunrise to 8:00.
Note that, ignoring DST, the latest sunrise is typically in January rather than at the winter solstice. But also in some southern areas (including where I live), the seasonal variation in sunrises is small enough that the latest sunrise time is actually in March or November, right after the shift to DST or before the shift back to Standard Time.
I’m not going to post the Python code I used for this because it was AI-assisted and sloppily thrown together. I used geopandas to read Natural Earth time zone data (both AI choices), and skyfield based on my previous experience with astronomical calculations. I used scipy to solve for the boundary points and then shaded the regions using matplotlib.