Wilderness Park
Wilderness Park

Wildflower

LA Marathon
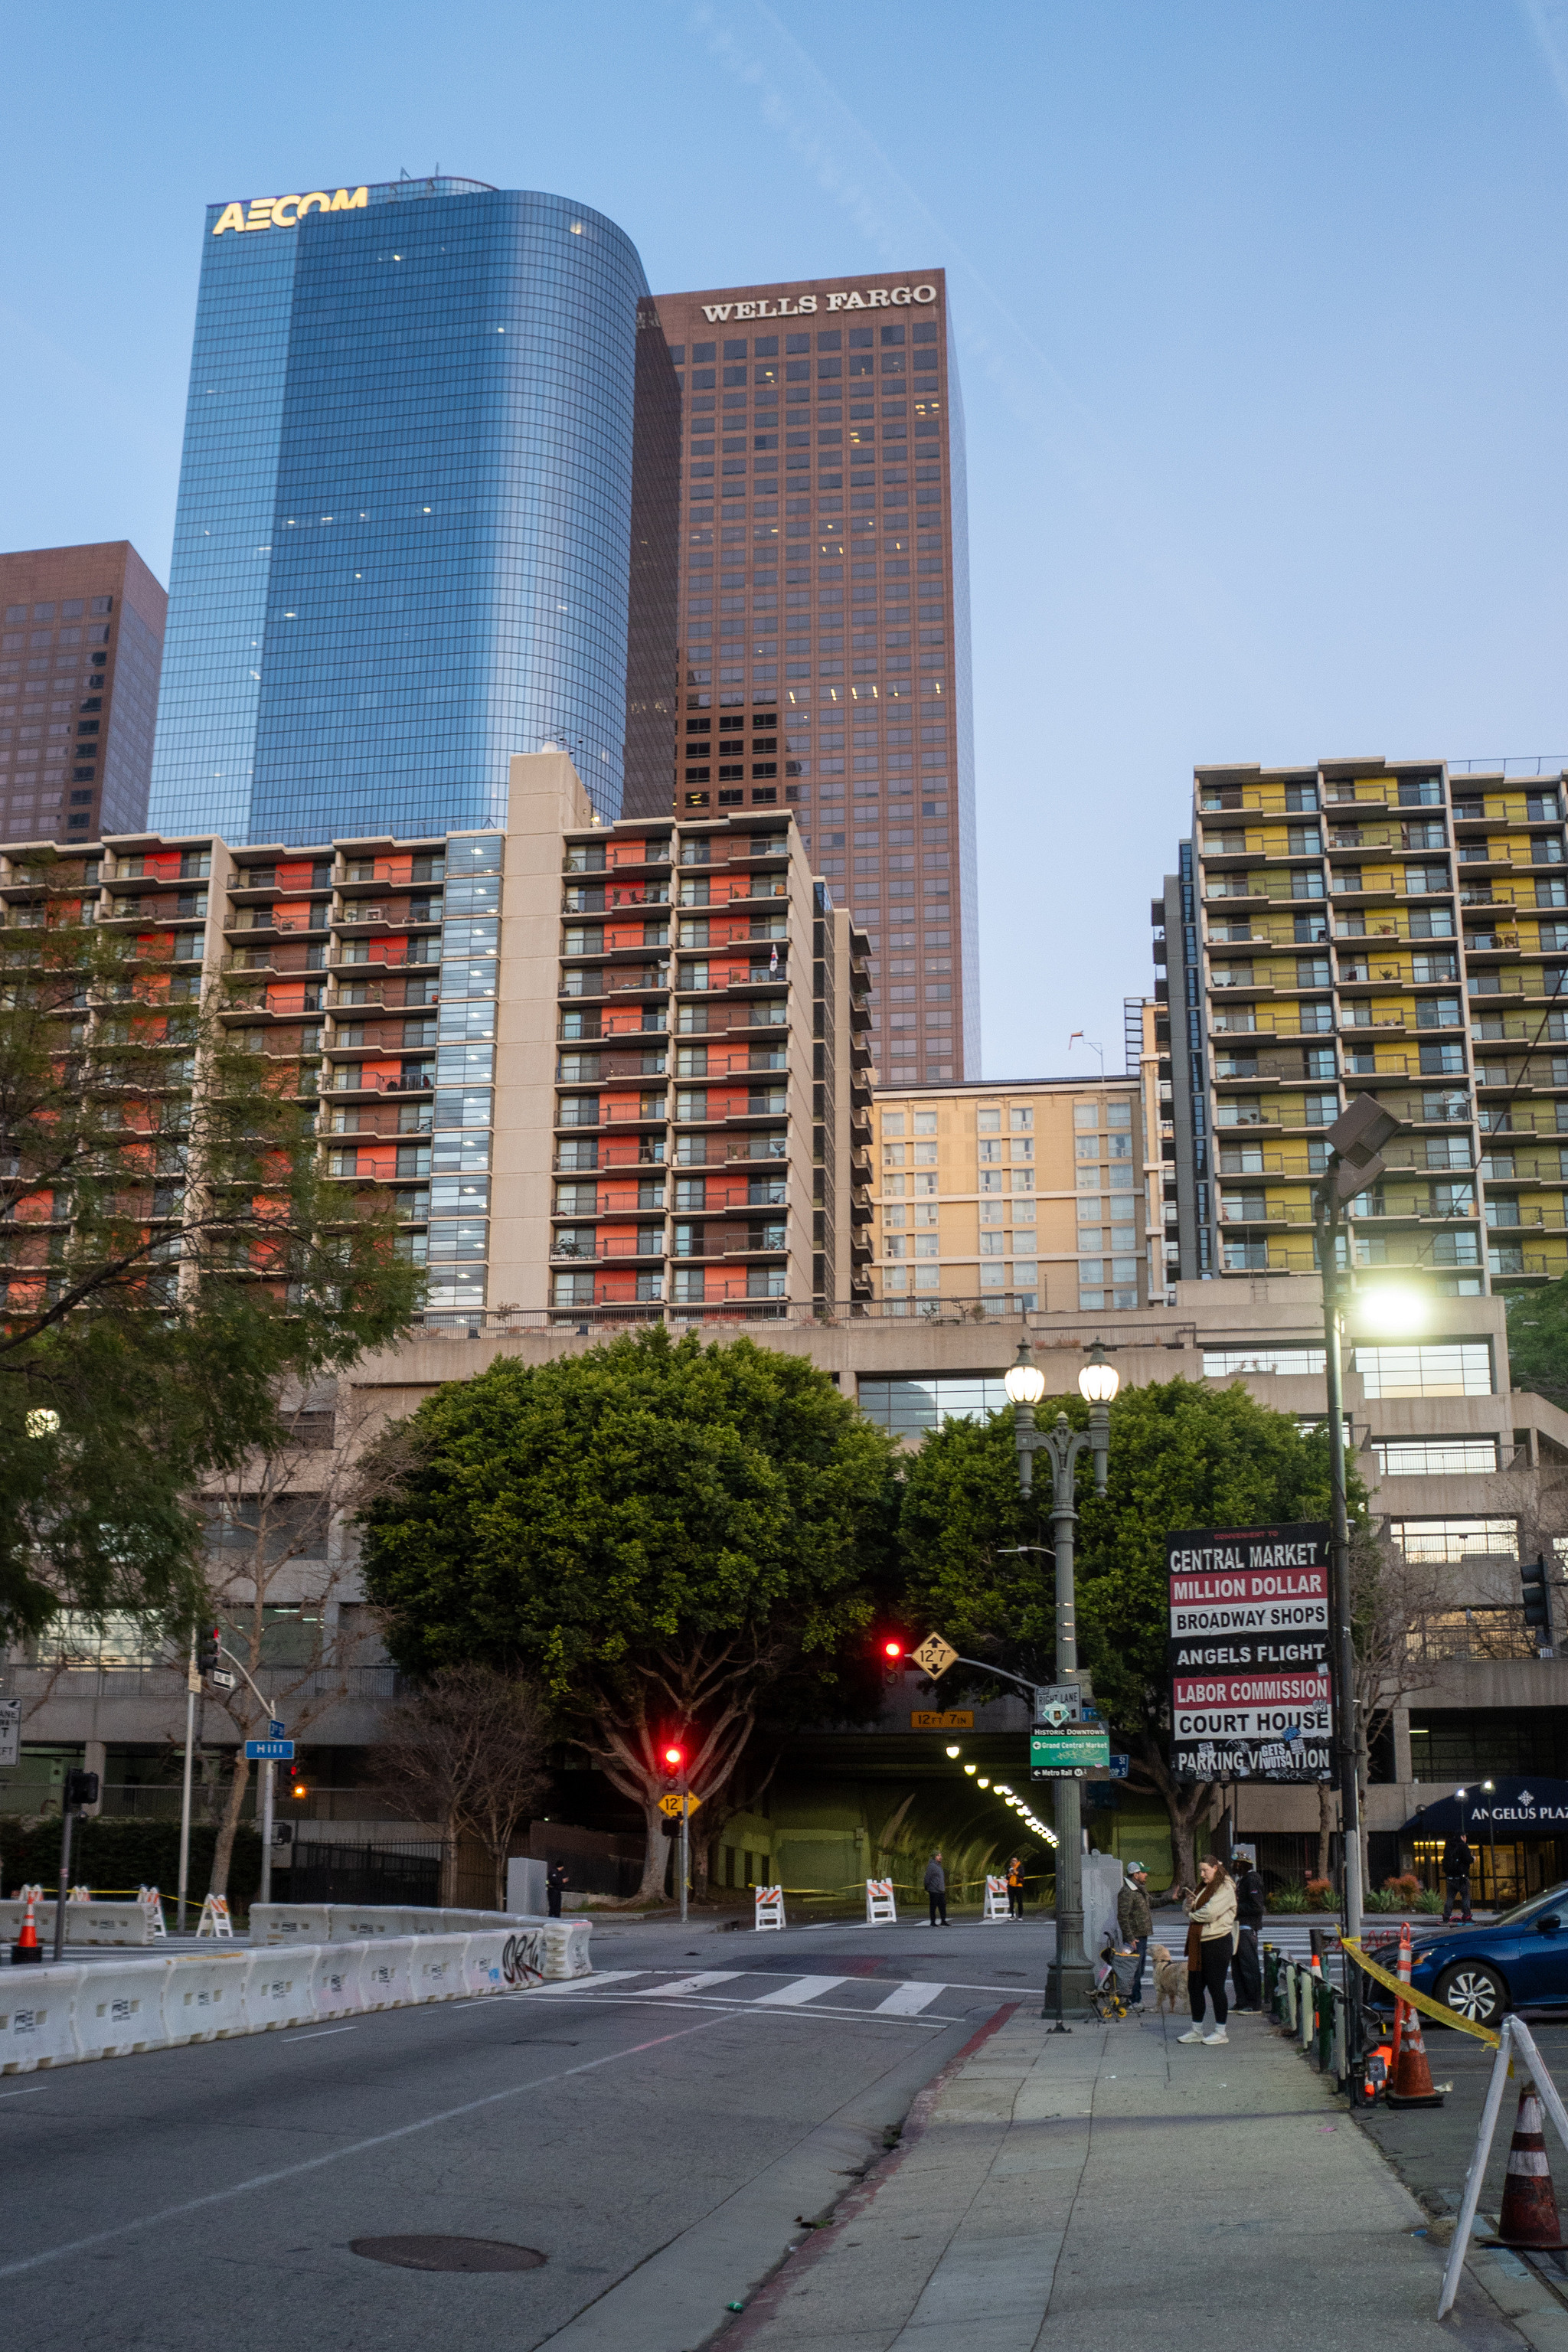
DTLA in the morning, waiting for the marathon to arrive
It is bad enough that we are leaving our children an overly warm planet, now they get a wrecked country to go with it.
The battery on my Magic Trackpad began to swell.
I bought new one. USB-C! Black!
Now I want a black keyboard, but I don’t want a number pad. Give me choices, Apple!
I have about 30 Leviton Wi-Fi switches in my house, because when I installed them, there wasn’t a clear leader between Z-Wave, Zibgee, Matter, etc. For years they worked without any issues, but recently they have been losing their network connection, about 3-4 switches per week.
After some experimentation, I set the minimum RSSI for my access points to -80 dBm, which essentially kicks a light switch off the Wi-Fi if it has a poor signal. The goal is for it to reconnect to an access point that is nearer.
I’m happy to say that three weeks later I have not had a single unresponsive switch.
I highly recommend staying away from Zelle. I had come to rely on it somewhat only to find out that there are fairly low transfer limits. If you hit your limits, you might not be able to send money for a month. I don’t understand, do they want us to use their service or not?
In 2015 there was a measles outbreak in Southern California, which I remember vividly because I had an infant at the time. The state responded by eliminating personal belief exemptions for vaccines.
Have things improved since then? My gut tells me no, since increased government efforts can be easily overwhelmed by a concerted anti-vaccination push. But CDC data shows that from 2011 to 2023, California exemption rates dropped by 2.5 percentage points (2.6% to 0.1%) while MMR vaccination rates for kindergarteners increased by 3 percentage points (93% to 96%). Meanwhile, in my birth state of Idaho, exemption rates increased by 9 percentage points (5% to 14%) and MMR vaccination rates decreased by 9 percentage points (89% to 80%).
After my last astronomy post, I was curious if I could develop a cosmic sense of direction, to know, day or night, where Sirius is the same way I generally know which way is north.
So I built this interactive sidereal clock. I wil explain a little bit about how it works and then how I got there.
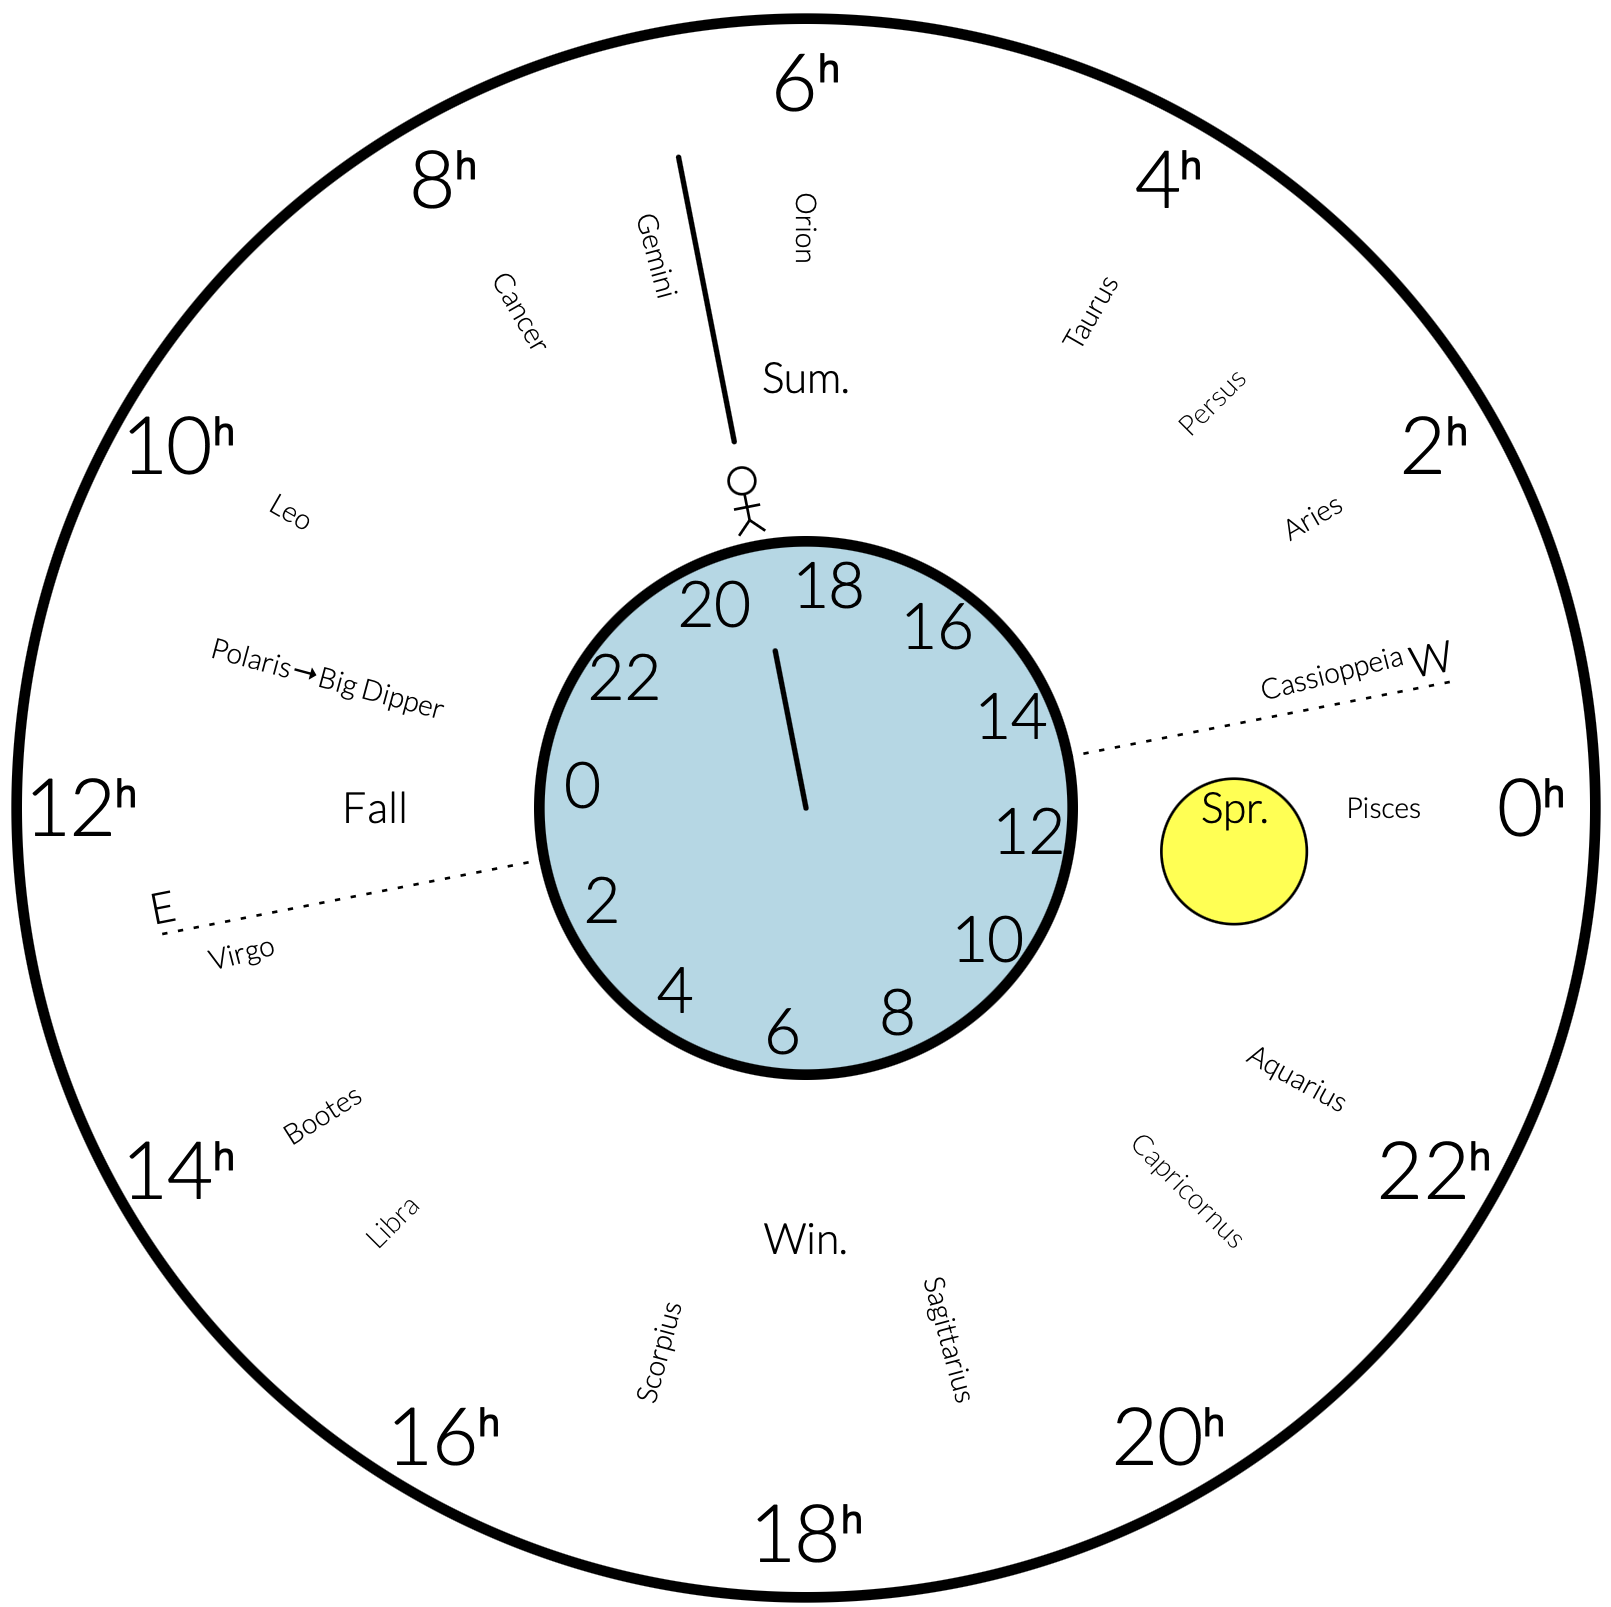
(This is a screenshot. Click through to see the real version.)
The clock displays both solar time (24 hours per day) and sidereal time (four fewer minutes per day, but measured as 24 sidereal hours). The outside circle shows the sidereal hours, and the inner circle (representing Earth) shows the solar hours.
Just like 12:00 solar time is when the Sun is at its peak, 6:00 sidereal time is when Betelgeuse in Orion is at its peak. Because stars are so far away, they don’t seem to move much relative to each other, so every (non-polar) star has a fixed sidereal time when it reaches its peak. This is also called right ascension, abbreviated RA.
The right ascension is essentially a measure of longitude, and at 6:00, the 6ʰ line runs from Polaris, straight across the highest point of the sky and down to the southern horizon, where out of sight from the northern hemisphere it hits the south celestial pole. At the same time, the 12ʰ line goes from Polaris down to the eastern horizon, and the 0ʰ line to the western horizon. Also at that time, a small part of the 18ʰ line is visible in the northern hemisphere, from Polaris straight to the northern horizon.
In the interactive clock, you can drag the Sun around to represent different times of year. This shows you the relative position of the Sun, Earth, and stars at that time of year. You can see that the winter solstice is when the Earth is between the Sun and Orion. In other words, the northern hemisphere is always, regardless of the season, tilted towards Orion. (That won’t last forever, but it will for my lifetime.) I marked the four seasons on the clock, and when the Sun circles a season, that represents the solstice or equinox (again, in the northern hemisphere).
You can also drag the little human standing on Earth to adjust the time of day. The perspective of the Earth is looking down from above the north pole. It is easiest to imagine yourself standing on Earth looking south, with the eastern horizon on your left and the western horizon on your right. Although, again, to see the entire line corresponding to the current sidereal time, you will have to look up, up, up, and a little backwards, until you see Polaris.
You can see the difference between sidereal and solar time, because if you drag the guy once around, the Sun will have moved slightly so you have to drag a bit further to complete a solar day.
The effect of the Earth’s tilt on the Sun’s position is not shown here. The Sun’s RA is correct, though. The relative movement of the Sun above or below the Earth’s equator is what causes it to rise somewhat before or after 6am, depending on your latitude and the season.
Although I’ve never had a very good grasp on astronomy, it is not for lack of experience. When I was young, my mom was very interested in astronomy, and we used to drive out to the potato fields of Idaho to see the night sky. We had a Planisphere. We had star mapping software, probably DOS-based, but I don’t remember which. But everything, to me, always felt like it was moving, and never in a way I could understand or visualize. (I think most astronomy software is especially confusing in this respect.)
For this reason, I really wanted something that let me imagine the stars holding still, while the Earth and Sun moved. As far as I know, there isn’t a “standard” way to depict the night sky, but to my math brain it made sense to put 0 on the positive x axis. A top-down view allows you to have the cardinal directions in their normal locations, although it prioritizes the southern sky and makes the clock run counterclockwise. At my latitude, the equatorial and mid-southern cosntellations make up more of the sky anyway. If I still lived in Idaho or the Pacific Northwest, it might make more sense to flip things around and look up at the earth from below, since the polar constellations are so much more prominent and probably an easier way to orient yourself.
I used Javascript (mostly d3) to build an SVG file. At first I had sliders for the time of year and time of day, and then I realized I could just watch for drag events on certain parts of the image. Feel free to take a look at the code, it is only a few hundred lines of very spaced out code.
I used a Planisphere to make sure that I was getting things correct.
I had a ton of fun making this. The process of working everything out really helped it click into my brain.
Ultimately, the easiest way to orient myself seems to be to think first about where the Sun is in relation to the stars, and then where I am in relation to the Sun, rather than think explicitly about sidereal time. Which is essentially how it has been done for thousands of years with the Zodiac, but I find that the extra step of fixing the Earth’s orbit as up-down-left-right is critical for my spatial awareness.
I don’t know how anyone can argue that LTE is “fast enough” compared to 5G. Seeing LTE in the status bar is enough to convince me to put my phone down for a while.
And millimeter wave is amazing. I get faster than 1 Gbps cellular download at my office, so that I don’t even bother connecting my phone to wifi.
In a recent post, I made a bit of an eye-roll comment about how Letterboxd rejects requests based on their user-agent header. Then today, it happened when I was making a request to my own website. I know (or thought) that I don’t do anything so ridiculous, so I set out to investigate.
I host my site these days on a Linode instance using nginx, which I was pretty sure doesn’t do anything strange based on user-agent headers. Looking at my logs showed that my request wasn’t making it to ngnix.
When Google Domains shut down, I migrated my DNS hosting to Cloudflare, so that was the next possible culprit. Cloudflare offers traffic proxying, so that all of your traffic goes to their servers, and they send requests to your servers. This isn’t something I was looking for when I switched, but they make it easy or maybe even the default.
Inspecting the actual response that I was getting in Python, I saw the message
error code: 1010. (For Letterboxd, I had seen the 403 response and hadn’t
looked deeper into it, but it was probably the same thing.) Some searching
confirmed that this was indeed coming from Cloudflare.
If you go to “Security > Settings” in the Cloudflare dashboard, you can turn off “Browser Integrity Check,” which fixes the problem. Or just turn off proxying entirely, although that takes a little longer to take effect, because the DNS settings need time to propagate.
What started off as a quick project to get the moon’s position each day turned into something bigger, after I realized that I knew so little about astronomy that even my grandparents would be ashamed.
What made it fun was the amazing amount of data and resources I had to convert whatever questions I had into graphs and pictures, until I finally reached the level of understanding of the first chapter of an introductory astronomy textbook.
What I knew going into this project was that the moon rises and sets from seemingly random parts of the sky, unlike the sun which, where I live, slowly progresses from southeast in the winter, to east at the equinoxes, and northeast in the summer. (Again, if you know anything about astronomy, you already understand why this happens, but bear with me for the charts, at least.)
I found the excellent Skyfield Python library, which downloads a set of position and velocity data for solar system objects, and lets you make computations based on these. (Note: I didn’t design that website, even though it looks uncannily similar to this one.) This is what I was using anyway to find out when the moonrise and moonset were, the current phase of the moon, and the location of the moon.
Here is how you find out the next moonrise, for example:
import datetime
from skyfield import api, almanac
import zoneinfo

EPH = api.load('de440s.bsp')
TZ = zoneinfo.ZoneInfo("America/Los_Angeles")
ts = api.load.timescale()

me = EPH['Earth'] + api.wgs84.latlon(33, -118)
t, _ = almanac.find_risings(
    me, EPH['Moon'], ts.now(), ts.now() + datetime.timedelta(hours=26))

print(t.astimezone(TZ))
This actually gives you all moonrises in the next 26 hours, which will usually be a Numpy array of length 1. What the library is doing is using the location of the earth and moon from the EPH file (which the library auto-downloads) to determine where the moon is with respect to you and your current horizon, and find out when it crosses into view.
If you want to find the current position of the Moon, you can use
altitude, azimuth, _ = me.at(ts.now()).observe(moon).apparent().altaz()
There is already fun stuff going on here (although mostly irrelevant for the
broader question). You start with the Barycentric coordinates of me, which
gives your current location in the solar system. Calling observe converts the
moon’s position to an Astrometric position, which takes into account the speed
of light (rewinding the moon’s position by 1.3 seconds). Then apparent takes
gravity into account. My instinct is that this is overkill for the moon, but
should have some effect on the planets.
Anyway, this gives you the apparent altitude of the moon, with 90° being straight up, zero for on the horizon, and negative numbers for below the horizon. And you get the azimuth from 0° to 360°, which is the compass direction you should face to see the moon.
Everything in Skyfield works on Numpy arrays as well, so you can compute
several points at once. For example, here is a polar plot of one month’s worth
of moon paths, with a transformation of the azimuth so that 90° is at the
origin and 0° is on the unit circle. I set negative altitudes to np.nan so
that they won’t be drawn on the plot.
from matplotlib import pyplot as plt
import numpy as np

t = ts.linspace(ts.utc(2025, 2, 7), ts.utc(2025, 3, 7))
altitude, azimuth, _ = me.at(ts.now()).observe(EPH['Moon']).apparent().altaz()
th = azimuth.radians
y = altitude.radians
y[y < 0] = np.nan
r = np.tan(np.pi/4 - y/2)
fig, ax = plt.subplots(subplot_kw={'projection': 'polar'})
ax.set_theta_zero_location('N')
ax.set_theta_direction(-1)
ax.plot(th, r)
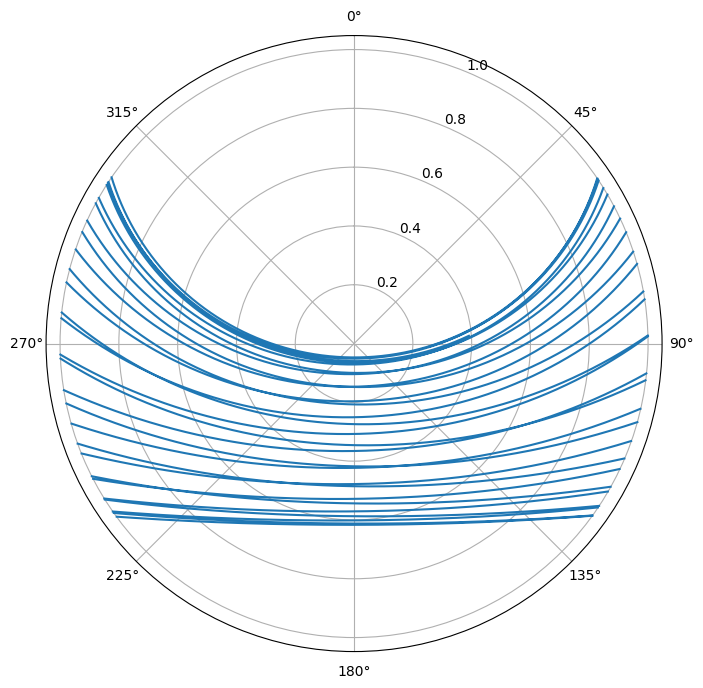
You also can use a different projection to get the same picture in a way that looks a little more like how it would look if you were facing south and watching it for the whole month. Note that this covers all phases of the moon, including the new moon, which you might have a hard time seeing in real life.
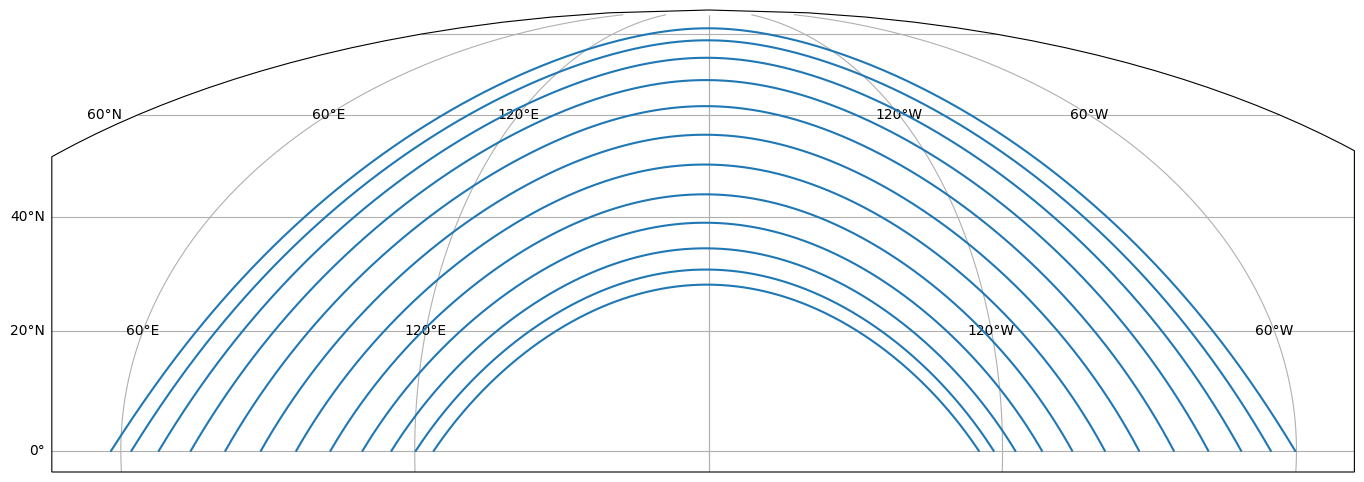
It appears that the location of the moon throughout one night or day is determined primarily by where it rises, so I made a graph for an entire year of the azimuth at moonrise:
t0, t1 = ts.utc(2025, 1, 1), ts.utc(2026, 1, 1)
t, _ = almanac.find_risings(me, EPH['Moon'], t0, t1)
_, azimuth, _ = alt, az, _ = me.at(t).observe(moon).apparent().altaz()
phase_t, phase = almanac.find_discrete(t0, t1, almanac.moon_phases(EPH))
fig, ax = plt.subplots(figsize=(10, 4))
ax.plot(t.utc_datetime(), azimuth.degrees)
full_moon_t = phase_t[phase==2].utc_datetime()
ax.set_xticks(full_moon_t, labels=[x.strftime('%b %e') for x in full_moon_t])
ax.xaxis.grid(True, color='black')
This finds all of the risings during the year as a Numpy array, then finds the corresponding array of azimuths. For reference, I also found all of the moon phases of the year (0 is new moon, 2 is full) and used that as the x-grid.
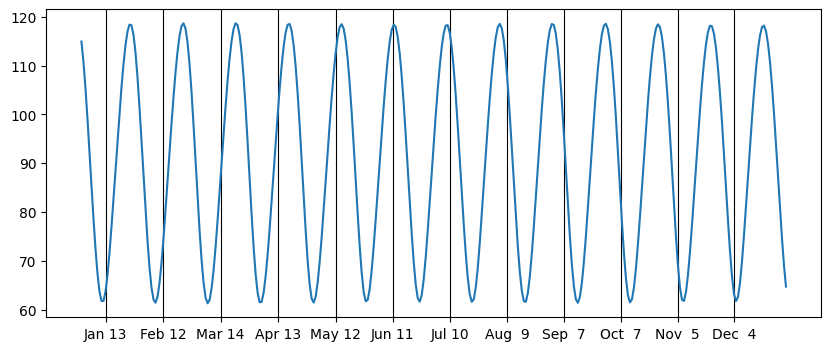
Here is where I first realized the pattern, which is that at the summer solstice, when the sunrise is furthest north, the full moon is furthest to the south (and takes the shortest path across the sky), while at the winter solstice, when the sun is furthest south, the full moon is furthest to the north (and takes the longest path across the sky). This makes sense because when the moon is full, it is opposite the sun. Similarly, for new moons, the moon matches the sun’s position, which also is what I expected.
I still didn’t really understand what was going on between, and for a brief period, I thought that all of this movement was a result of the 5-degree tilt of the moon’s orbit that I had read about. But the numbers were too big for that, and quickly I realized that I didn’t even know whether the 5-degree tilt was with respect to the earth’s equator or the earth’s orbit around the sun.
Doing a bit more poking around and looking at an actual textbook, I confirmed that it was indeed the earth’s tilt that was the primary cause of the moon’s apparent motion, that is, that the moon orbit stays close to the plane of the earth’s orbit around the sun.
Everything finally clicked, and I realized that, due to the moon’s orbit, the earth is tilted towards and away from the moon just like it is from the sun, going through a cycle once a month rather than once a year. And of course, slightly out of sync with the moon phase cycle, which is shorter than the moon’s orbit cycle due to our revolution around the sun.
And then I learned what I should have remembered from high school, or from knowledge passed on from my ancestors, that the ecliptic, the imaginary line through the sky that coincides with the intersection of the earth with its orbital plane, the line that contains all of the zodiac constellations, does about the same wibble-wobble that the Moon does, and what I am really seeing is the effect of the earth spinning along a different axis from its solar orbit.
Actually, this lack of basic knowledge is what tripped me up when I was first reading about this, because in more than one place, I read that the moon went further north or south from one night to the next because “it rises later.” Which doesn’t make any sense at all, unless you think of the moon as constrained to the ecliptic and the point where the ecliptic touches the horizon as oscillating back and forth as in this animation. My lack of intuition about the stars also manifested when I read things like “the moon’s orbit makes it appear to move west to east across the sky.” Which is silly because obviously the moon appears to move east to west just like the sun and all of the stars, but if you can imagine the star field as fixed, then you can see the moon’s eastward movement.
That’s the end of my journey for now. It was fun. The solar system is exciting, and I can’t believe how painstakingly ancient humans tracked the stars, sun, and moon over time to gain all of this knowledge, when we can just download a file and get to work.
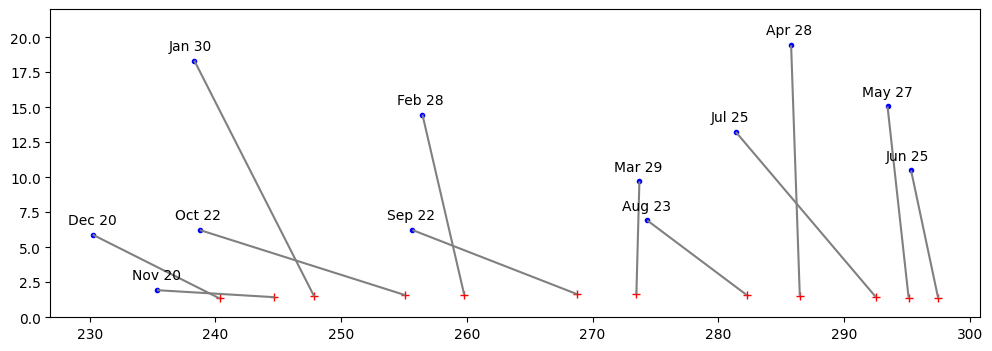
Okay, one last graph that I drew. It shows the 12 crescent moons of 2025 and their positions relative to the setting sun. At the bottom is the position of the sun, just before sunset. At the top is the location of the moon at the same time, about one day after new. The line that connects them is labeled with the date. Here you can see clearly the difference between the spring moon, where, as the moon orbits towards first quarter, it approaches the northern hemisphere. Contrast that with the fall moon, which is headed towards the southern hemisphere, and so will appear much further to the south, and set to the south of the sunset.

Power substation
After all of Casey’s Home Assistant talk, I finally gave in and tried it out. The number of integrations it has with different devices is impressive, and the event-based programming you can do is fun. Template-focused programming is tedious, but almost anything is better than Homekit and (maybe this is a hot take) Shortcuts.