What started off as a quick project to get the moon’s position each day turned into something bigger, after I realized that I knew so little about astronomy that even my grandparents would be ashamed.
What made it fun was the amazing amount of data and resources I had to convert whatever questions I had into graphs and pictures, until I finally reached the level of understanding of the first chapter of an introductory astronomy textbook.
What I knew going into this project was that the moon rises and sets from seemingly random parts of the sky, unlike the sun which, where I live, slowly progresses from southeast in the winter, to east at the equinoxes, and northeast in the summer. (Again, if you know anything about astronomy, you already understand why this happens, but bear with me for the charts, at least.)
I found the excellent Skyfield Python library, which downloads a set of position and velocity data for solar system objects, and lets you make computations based on these. (Note: I didn’t design that website, even though it looks uncannily similar to this one.) This is what I was using anyway to find out when the moonrise and moonset were, the current phase of the moon, and the location of the moon.
Here is how you find out the next moonrise, for example:
import datetime
from skyfield import api, almanac
import zoneinfo

EPH = api.load('de440s.bsp')
TZ = zoneinfo.ZoneInfo("America/Los_Angeles")
ts = api.load.timescale()

me = EPH['Earth'] + api.wgs84.latlon(33, -118)
t, _ = almanac.find_risings(
    me, EPH['Moon'], ts.now(), ts.now() + datetime.timedelta(hours=26))

print(t.astimezone(TZ))
This actually gives you all moonrises in the next 26 hours, which will usually be a Numpy array of length 1. What the library is doing is using the location of the earth and moon from the EPH file (which the library auto-downloads) to determine where the moon is with respect to you and your current horizon, and find out when it crosses into view.
If you want to find the current position of the Moon, you can use
altitude, azimuth, _ = me.at(ts.now()).observe(moon).apparent().altaz()
There is already fun stuff going on here (although mostly irrelevant for the
broader question). You start with the Barycentric coordinates of me, which
gives your current location in the solar system. Calling observe converts the
moon’s position to an Astrometric position, which takes into account the speed
of light (rewinding the moon’s position by 1.3 seconds). Then apparent takes
gravity into account. My instinct is that this is overkill for the moon, but
should have some effect on the planets.
Anyway, this gives you the apparent altitude of the moon, with 90° being straight up, zero for on the horizon, and negative numbers for below the horizon. And you get the azimuth from 0° to 360°, which is the compass direction you should face to see the moon.
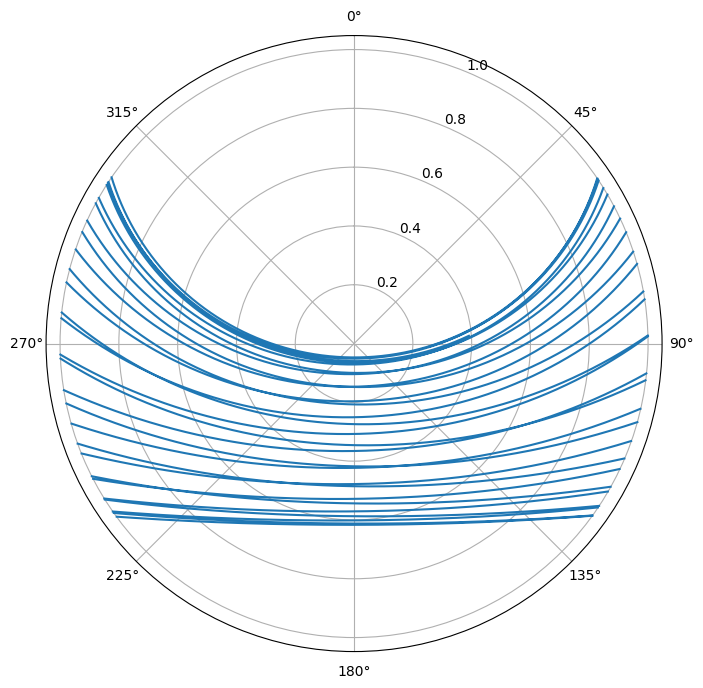
Everything in Skyfield works on Numpy arrays as well, so you can compute
several points at once. For example, here is a polar plot of one month’s worth
of moon paths, with a transformation of the azimuth so that 90° is at the
origin and 0° is on the unit circle. I set negative altitudes to np.nan so
that they won’t be drawn on the plot.
from matplotlib import pyplot as plt
import numpy as np

t = ts.linspace(ts.utc(2025, 2, 7), ts.utc(2025, 3, 7))
altitude, azimuth, _ = me.at(ts.now()).observe(EPH['Moon']).apparent().altaz()
th = azimuth.radians
y = altitude.radians
y[y < 0] = np.nan
r = np.tan(np.pi/4 - y/2)
fig, ax = plt.subplots(subplot_kw={'projection': 'polar'})
ax.set_theta_zero_location('N')
ax.set_theta_direction(-1)
ax.plot(th, r)
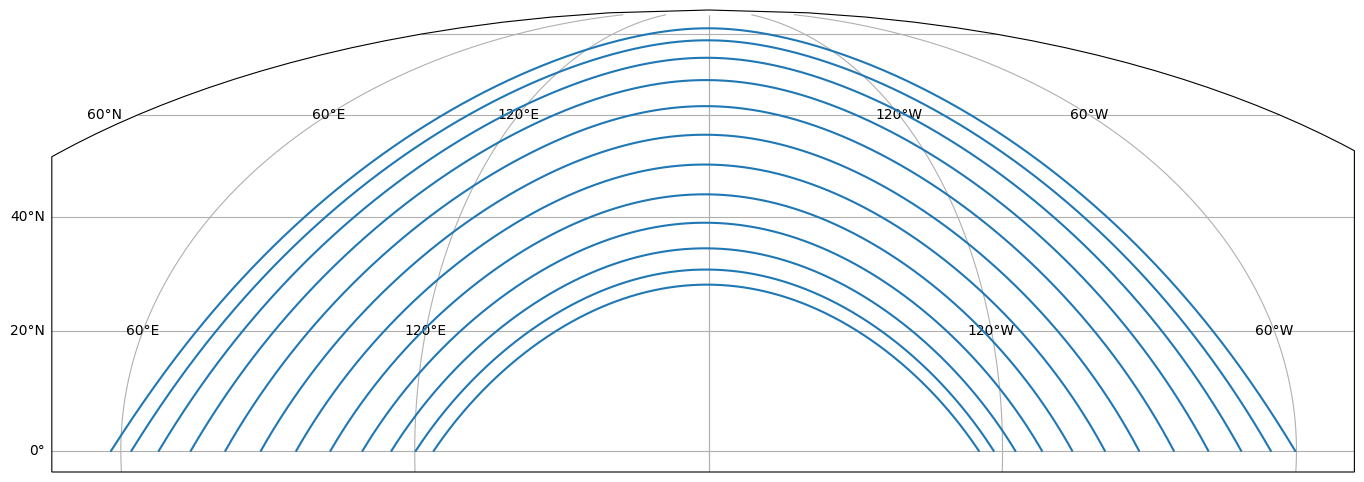
You also can use a different projection to get the same picture in a way that looks a little more like how it would look if you were facing south and watching it for the whole month. Note that this covers all phases of the moon, including the new moon, which you might have a hard time seeing in real life.
It appears that the location of the moon throughout one night or day is determined primarily by where it rises, so I made a graph for an entire year of the azimuth at moonrise:
t0, t1 = ts.utc(2025, 1, 1), ts.utc(2026, 1, 1)
t, _ = almanac.find_risings(me, EPH['Moon'], t0, t1)
_, azimuth, _ = alt, az, _ = me.at(t).observe(moon).apparent().altaz()
phase_t, phase = almanac.find_discrete(t0, t1, almanac.moon_phases(EPH))
fig, ax = plt.subplots(figsize=(10, 4))
ax.plot(t.utc_datetime(), azimuth.degrees)
full_moon_t = phase_t[phase==2].utc_datetime()
ax.set_xticks(full_moon_t, labels=[x.strftime('%b %e') for x in full_moon_t])
ax.xaxis.grid(True, color='black')
This finds all of the risings during the year as a Numpy array, then finds the corresponding array of azimuths. For reference, I also found all of the moon phases of the year (0 is new moon, 2 is full) and used that as the x-grid.
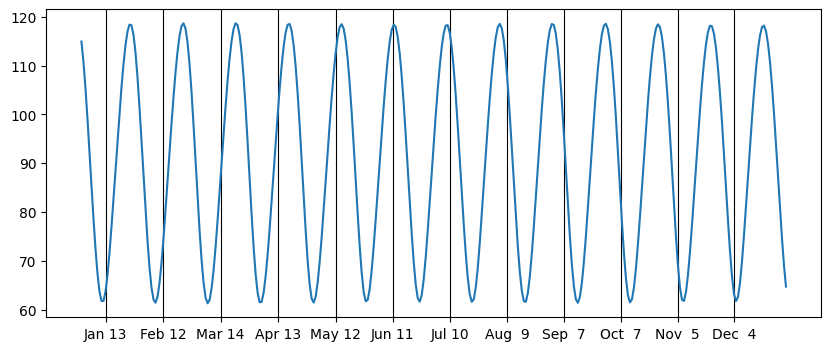
Here is where I first realized the pattern, which is that at the summer solstice, when the sunrise is furthest north, the full moon is furthest to the south (and takes the shortest path across the sky), while at the winter solstice, when the sun is furthest south, the full moon is furthest to the north (and takes the longest path across the sky). This makes sense because when the moon is full, it is opposite the sun. Similarly, for new moons, the moon matches the sun’s position, which also is what I expected.
I still didn’t really understand what was going on between, and for a brief period, I thought that all of this movement was a result of the 5-degree tilt of the moon’s orbit that I had read about. But the numbers were too big for that, and quickly I realized that I didn’t even know whether the 5-degree tilt was with respect to the earth’s equator or the earth’s orbit around the sun.
Doing a bit more poking around and looking at an actual textbook, I confirmed that it was indeed the earth’s tilt that was the primary cause of the moon’s apparent motion, that is, that the moon orbit stays close to the plane of the earth’s orbit around the sun.
Everything finally clicked, and I realized that, due to the moon’s orbit, the earth is tilted towards and away from the moon just like it is from the sun, going through a cycle once a month rather than once a year. And of course, slightly out of sync with the moon phase cycle, which is shorter than the moon’s orbit cycle due to our revolution around the sun.
And then I learned what I should have remembered from high school, or from knowledge passed on from my ancestors, that the ecliptic, the imaginary line through the sky that coincides with the intersection of the earth with its orbital plane, the line that contains all of the zodiac constellations, does about the same wibble-wobble that the Moon does, and what I am really seeing is the effect of the earth spinning along a different axis from its solar orbit.
Actually, this lack of basic knowledge is what tripped me up when I was first reading about this, because in more than one place, I read that the moon went further north or south from one night to the next because “it rises later.” Which doesn’t make any sense at all, unless you think of the moon as constrained to the ecliptic and the point where the ecliptic touches the horizon as oscillating back and forth as in this animation. My lack of intuition about the stars also manifested when I read things like “the moon’s orbit makes it appear to move west to east across the sky.” Which is silly because obviously the moon appears to move east to west just like the sun and all of the stars, but if you can imagine the star field as fixed, then you can see the moon’s eastward movement.
That’s the end of my journey for now. It was fun. The solar system is exciting, and I can’t believe how painstakingly ancient humans tracked the stars, sun, and moon over time to gain all of this knowledge, when we can just download a file and get to work.
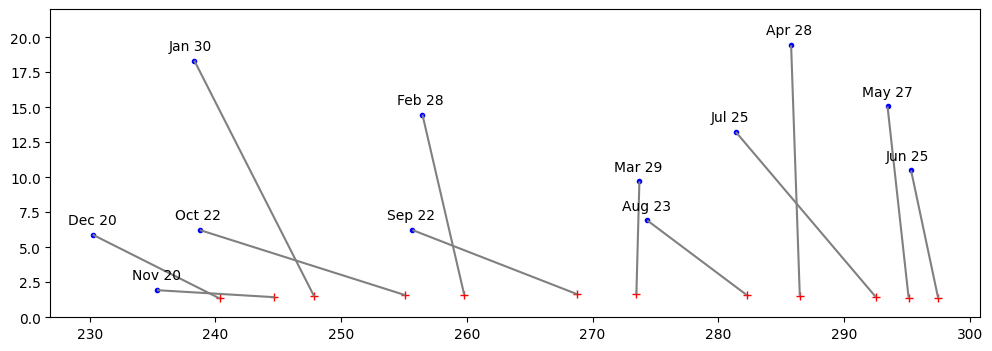
Okay, one last graph that I drew. It shows the 12 crescent moons of 2025 and their positions relative to the setting sun. At the bottom is the position of the sun, just before sunset. At the top is the location of the moon at the same time, about one day after new. The line that connects them is labeled with the date. Here you can see clearly the difference between the spring moon, where, as the moon orbits towards first quarter, it approaches the northern hemisphere. Contrast that with the fall moon, which is headed towards the southern hemisphere, and so will appear much further to the south, and set to the south of the sunset.